Ranking Rule Features and Values
The Feature Ranking task is a graphic visualization of the importance of attributes within a class (attribute ranking), and of the values within specific attributes (value ranking).
The task can be used with any task that generates rulesets, such as:
Hierarchical Basket Analysis (if the generated association rules are first converted into a ruleset)
Similar Items Detector (if the generated association rules are first converted into a ruleset)
Prerequisites
you must have created a flow;
the required datasets must have been imported into the flow;
a task has generated a ruleset in the flow.
Procedure
Drag the Feature Ranking task onto the stage.
Connect a task, which contains the ruleset you want to analyze, to the new task.
Double click the Feature Ranking task.
Configure the options described in the Feature Ranking options table below.
Feature Ranking options | |
Parameter Name | Description |
|---|---|
Attributes | The attributes present in the rules for each class, ordered according to the Order attributes by option. The attribute selected here will determine which attribute is displayed in the Value Ranking plot. |
Displayed relevances | You can decide whether you want to display plots that refer to:
This option is only available for nominal output values. |
Enable multi-plot | If checked, a plot is displayed for each relevance selected in the Displayed relevances option. This option is only available for nominal output values. |
Interval for output | You can select an interval of output values to be included in the Attribute Ranking plot. This option is only available for ordered output values. |
Order attributes by | You can select the criterion for sorting the list of attributes. Possible choices are by:
This option is applied to the Attribute Ranking plot. |
Order values by | You can select the criterion for sorting the values of each attribute. Possible choices are by:
This option is applied to the Value Ranking plot. |
Number of displayed attributes | Select the number of attributes you want to include in the Attribute Ranking plot. |
Number of displayed values | Select the number of attributes you want to include in the Value Ranking plot. |
Order by absolute values | If selected, relevances are ordered according to their absolute value. This is meaningful if have decided to display relative relevances which may also have negative values. |
Order relevances using absolute values | Selected by default, it allows to display the relevance of attributes ordered by their absolute values. This option is applied to the Attribute Ranking plot. |
Example
The following example uses the Adult dataset.
Description | Screenshot |
|---|---|
After having imported the dataset through an Import from Text File task and after having split it into training (70%) and test (30%) sets with a Split Data task, add a Logic Learning Machine (classification) task to the flow and define the attribute Income as output. Save and compute the task, then add a Feature Ranking task and open it. | 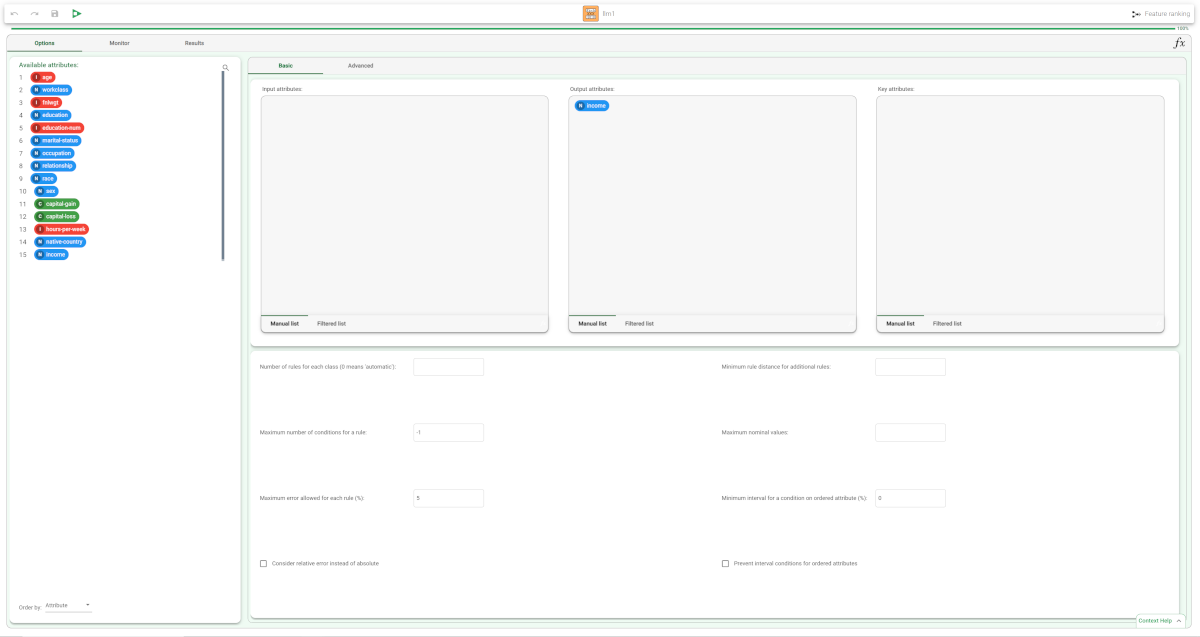 |
We have included 14 attributes in the plot. From the Attribute Ranking plot we can easily see that the education variable is the most important attribute in determining the output. | 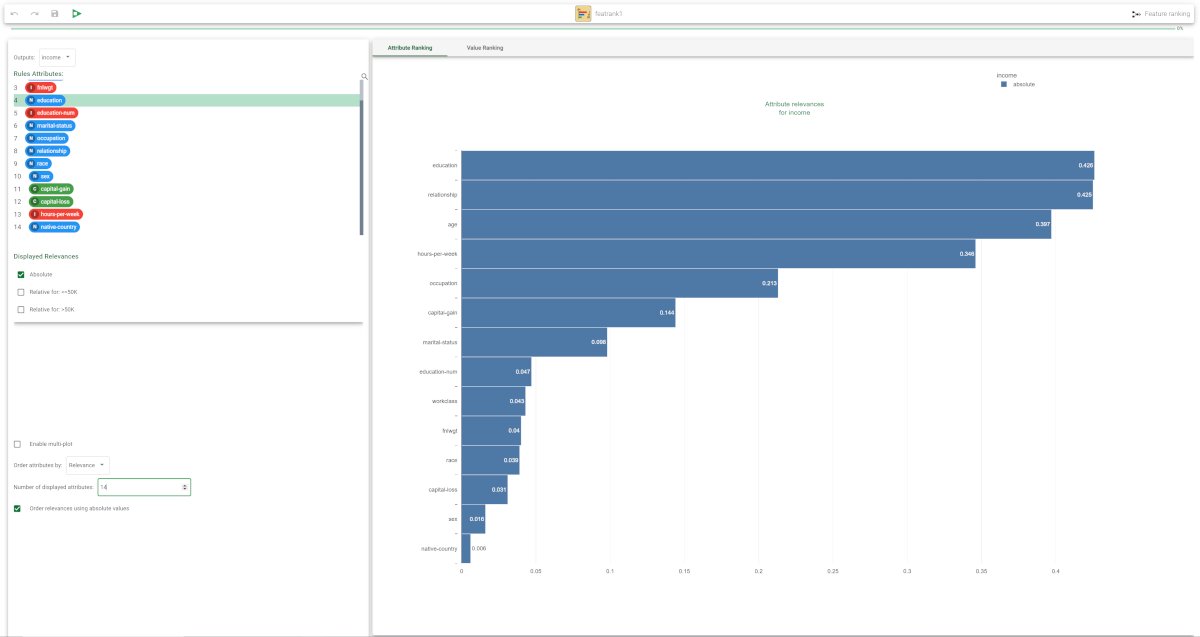 |
If we decide to display only the attributes related to an output <=50K the plot changes noticeably, and also contains negative values, indicating that the attribute is inversely correlated with that output value. If the Order by absolute values option is selected, attributes are sorted according to the absolute value of relevance. | 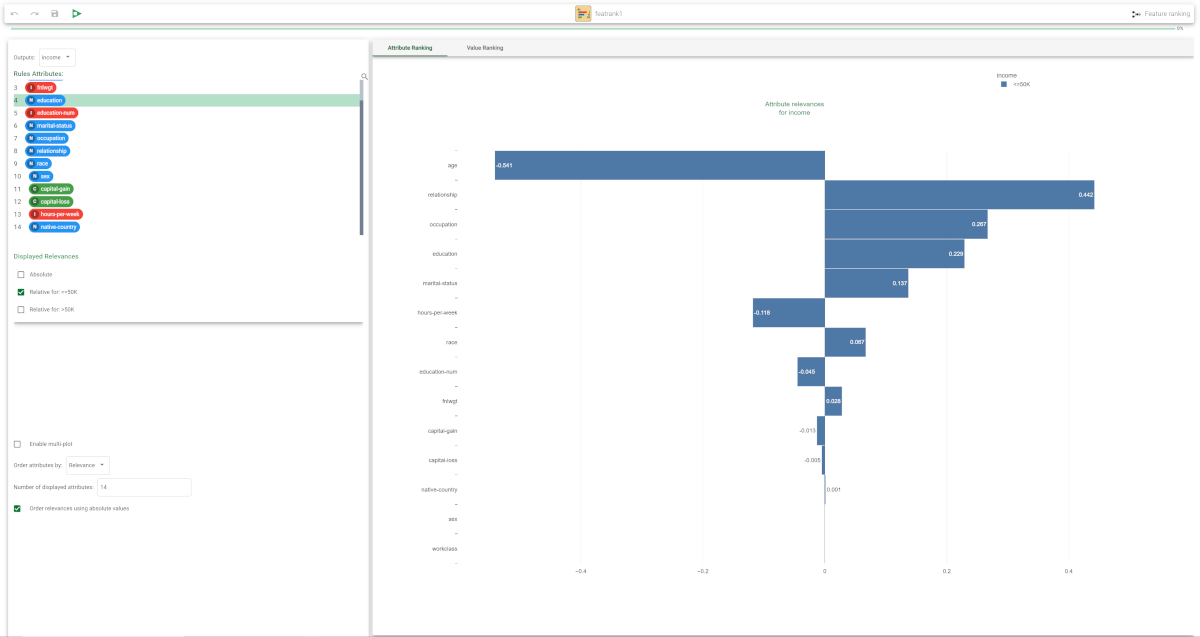 |
Clicking on the Value Ranking tab you can view the relevance of each interval, for selected attributes. In the example the relevances are displayed for the age attribute, in crescent order of importance. | 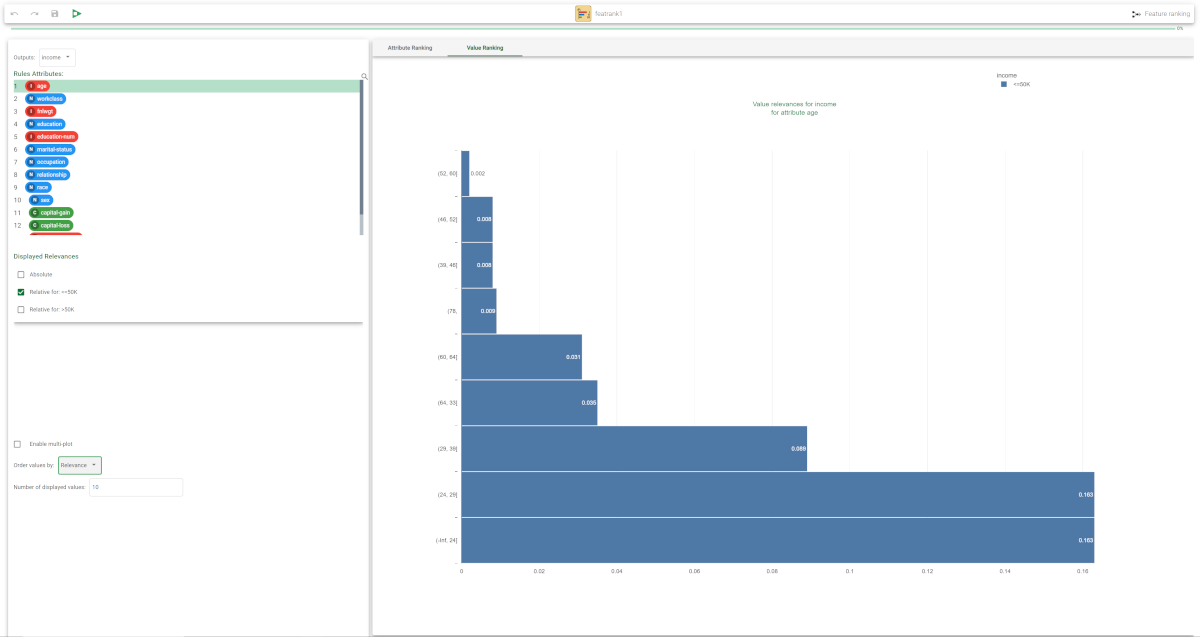 |