Analyzing Rules in the Rule Manager
The Rule Manager allows you to inspect, manipulate and optimize a set of rules.
It displays the rules and their conditions in a spreadsheet layout.
It can be used with any of the following LLM tasks that generate rulesets:
The task is divided into two tabs, the Rules tab and the History tab:
In the Rules tab, you can visualize the rules, add new ones and sort or filter them.
In the History tab, you can visualize all the operations performed and cancel them.
Prerequisites
you must have created a flow;
the required datasets must have been imported into the flow;
a task has generated a ruleset in the flow.
Procedure
Drag and drop the Rule Manager task onto the stage.
Connect a task, which contains the ruleset you want to analyze, to the new task.
Double click the Rule manager task. The left-hand pane displays how many rules have been generated and the percentage of these total rules are currently displayed in the ruleset. This percentage may change if modifications are made, such as applying filters or displaying rules only with selected attributes.
Filter results as described in the table below.
Save and compute the task.
Rule Manager Options (Rules tab)
The Rules tab is divided into three columns, which will be analyzed starting from the left:
Parameter | Description |
|---|---|
Filtering/Sort metadata | Select the parameters you want to filter by dragging them onto the Pre-filter area. The Pre-filter area works the same way it works in the Data Manager, go to the Pre-filtering Data in the Data Manager page to know more about all the filter options available. |
Rules attributes | Visualize the input and output attributes. |
Order by | Sort attributes by attribute (as in the dataset), name, type, ignored or role. |
Pre-filter | Filter the ruleset that will be used in the output by:
|
Filter conditions | Filter conditions so that any attributes that have not been selected in the Select rules containing lists are removed. |
Sort conditions by | Sort conditions according to their attributes, covering or error values. |
Clear | Click on it to clear the Operations table, removing all the created pre-filter operations, performed since the last time Make persistent was selected, and their effects to the dataset. |
Make persistent | Click on it to effectively apply all the query operations and permanently change the dataset. |
Results
The rule analysis is divided into three separate spreadsheets, located in the Rules tab:
Rules spreadsheet |
The Rule spreadsheet, with the generated ruleset, contains the following columns:
In this spreadsheet you can modify rules and conditions:
|
Covering spreadsheet |
The Covering spreadsheet, with additional information related to the covering of each rule in the following columns:
|
Error spreadsheet |
The Error spreadsheet, with additional information about the error scored by each rule in the following columns:
|
How to read the Covering and the Error spreadsheets - example
The following example uses the Adult dataset.
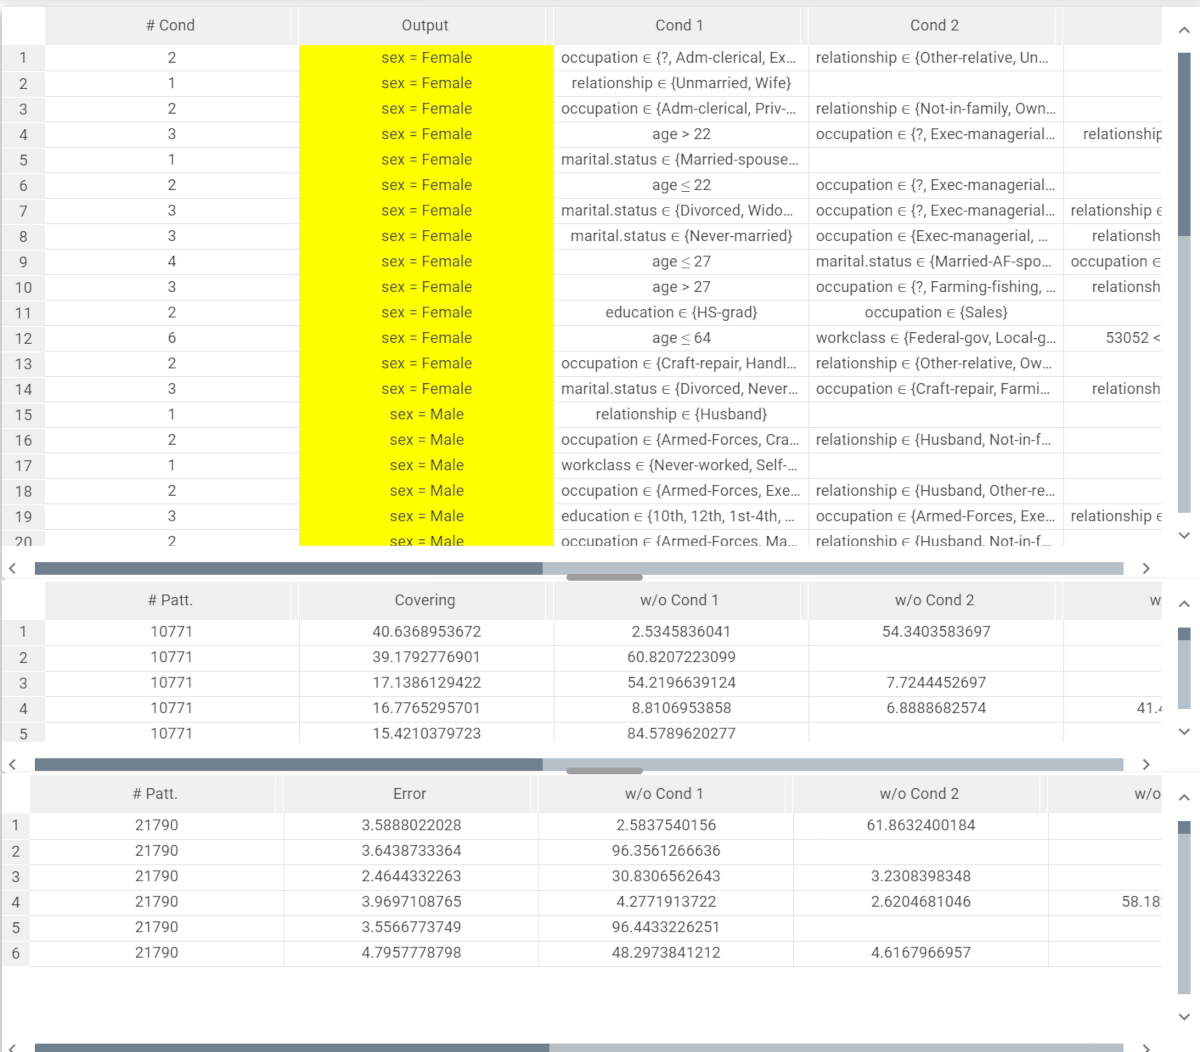
For each generated rule the number of patterns (that is the number of rows with the same output) a covering value is associated. The following columns (w/o Cond 1, w/o Cond 2 and so on) indicate the covering if the corresponding condition is removed. Considering this constraint, each time a condition is removed, the other covering values must be calculated again, as they have considered the initial conditions.
In this example, the Rule 1 has a 40.6% covering, meaning that the rule considers 40.6% of the rows with the output sex=female. w/o Cond 1 has a 2.53% value, while w/o Cond 2 has a 54.34% value.
If we remove Cond 1 we will obtain the following covering value: 40.6%+2.53%= 43%; subsequently, the Cond 2 will be calculated as follows: 100%-43%= 67% (because there is only one condition left after the Cond 1 removal)
If we remove Cond 2 we will obtain the following covering value: 40.6%+54.34% = 95%; subsequently, the Cond 1 will be calculated as follows: 100%-95%=5% (because there is only one condition left after the Cond 2 removal)
The logic explained above is valid for rules containing two or more conditions.
In row 2, which indicates rule 2, we only have one condition, so the sum between covering and w/o Cond 1 is 100%.
This logic can be applied to the Error spreadsheet as well.