Using Standard Clustering to Cluster Data
Rulex can cluster data with a k-means algorithm, by dividing a given dataset into k clusters. The statistical average of all the data items in the same cluster is defined as the cluster centroid.
A k-means (or k-medians, or k-medoids, according to the option specified by the user) clustering algorithm is employed to aggregate representative records with similar profiles. The centroid of each cluster provides the values of the profile attributes to be used in a subsequent Apply Model task when a new pattern is assigned to that cluster.
The input dataset contains the following attribute roles:
profile attributes: attributes to be employed to measure similarities in an unsupervised learning problem. To preserve generality a profile attribute can also be a label attribute. If nominal profile attributes are used, a combination of k-means and k-modes is adopted to deal with them.
cluster id: optional nominal attribute providing the initial cluster assignment for each pattern.
weight: optional variable used to provide a measure of relevance for each example in the dataset, thus affecting the position of the cluster centroid.
Prerequisites
you must have created a flow;
the required datasets must have been imported into the flow;
the data must have been well prepared;
a single unified dataset has been created by merging all the datasets imported into the flow
Additional tabs
The Monitor tab, where you can visualize the properties of the generated clusters.
The Clusters tab displays a spreadsheet displaying the values of the profile attributes for the centroids of created clusters, together with the number of elements and the dispersion coefficient (given by the normalized average distance of cluster members from the centroid) for each of them. In particular, the columns clustnum, nelem and normsdev contain the index of the cluster, the number of elements and the dispersion coefficient, respectively. The last row, characterized by a null index in the column clustnum
,reports the values pertaining to the default cluster, obtained by including in a single group all the elements of the training set.The Results tab, where a summary on the performed calculation is displayed, among which:
the execution time,
the number of valid training samples,
the average weight of training samples,
the number of clusters built,
the average dispersion of clusters,
the dispersion coefficient of the default cluster,
the minimum and the maximum number of points in clusters,
the number of singleton clusters, including only a point of the training set.
Procedure
Drag the Standard Clustering task onto the stage.
Connect a Split Data task, which contains the attributes you want to cluster, to the new task.
Double click the Standard Clustering task.
Configure the task options as described in the table below.
Save and compute the task.
Standard K-Means Clustering options | |
Parameter Name | Description |
|---|---|
Attributes to consider for clustering | Drag and drop the attributes that will be used as profile attributes in the clustering computation. |
Clustering type | Three different approaches for computing cluster centroids are available:
|
Clustering algorithm | Three different clustering algorithms are available:
|
Distance method for clustering | The method employed for computing distances between examples. Possible methods are: Euclidean, Euclidean (normalized), Manhattan, Manhattan (normalized), Pearson. Details on these methods are provided in the Distance parameter of the Managing Attribute Properties page. |
Distance method for evaluation | Select the method required for distance, from the possible values: Euclidean, Euclidean (normalized), Manhattan, Manhattan (normalized), Pearson. For details on these methods see the Managing Attribute Properties page. |
Normalization for ordered variables | Type of normalization adopted when treating ordered (discrete or continuous) variables. Every attribute can have its own value for this option, which can be set in the Data Manager. Details on these options are provided in the Distance parameter of the Managing Attribute Properties page. These choices are preserved if Attribute is selected in the present menu; every other value (e.g. Normal) supersedes previous selections for the current task. |
Initial assignment for clusters | Procedure adopted for the initial assignment of points to clusters; it may be one of the following:
|
(Optional) attribute for initial cluster assignment | Optionally select a specific attribute from the drop-down list, which will be used as an initial cluster assignment. |
(Optional) attribute for weights | Optionally select an attribute from the drop-down list, which will be used as a weight in the clustering process. |
Number of clusters to be generated | The required number of clusters. The number of clusters cannot exceed the number of different examples in the training set. |
Number of executions | Number of subsequent executions of the clustering process (to be used in conjunction with Random as the Initial assignment for clusters option); the best result among them is retained. |
Maximum number of iterations | Maximum number of iterations of the k-means inside each execution of the clustering process. |
Minimum decrease in error value | The error value corresponds to the average distance of each point from the respective centroid. This value, measured at each iteration, should gradually decrease. When the error decrease value (i.e. the difference in error between the current and previous iteration) falls below the threshold specified here, the clustering process stops immediately since it is supposed that no further significant changes in error will occur. |
Initialize random generator with seed | If checked, the positive integer shown in the box is used as an initial seed for the random generator; with this choice two iterations with the same options produce identical results. |
Keep attribute roles after clustering | If selected, roles defined in the clustering task (such as profile, labels, weight and cluster id) will be maintained in subsequent tasks in the flow. |
Aggregate data before processing | If checked, identical patterns in the training set are considered as a single point in the clustering process. |
Append results | Additional attributes produced by previous tasks are maintained at the end of the present one, rather than being overwritten. |
Example
The following example uses the Adult dataset.
Description | Screenshot |
|---|---|
After having imported the dataset through an Import from Text File task, drag a Data Manager onto the stage and link it to the import task. Open it, and choose to ignore the Income attribute by right clicking on it in the Attribute List and selecting Ignored>Set. Save and compute the task. | 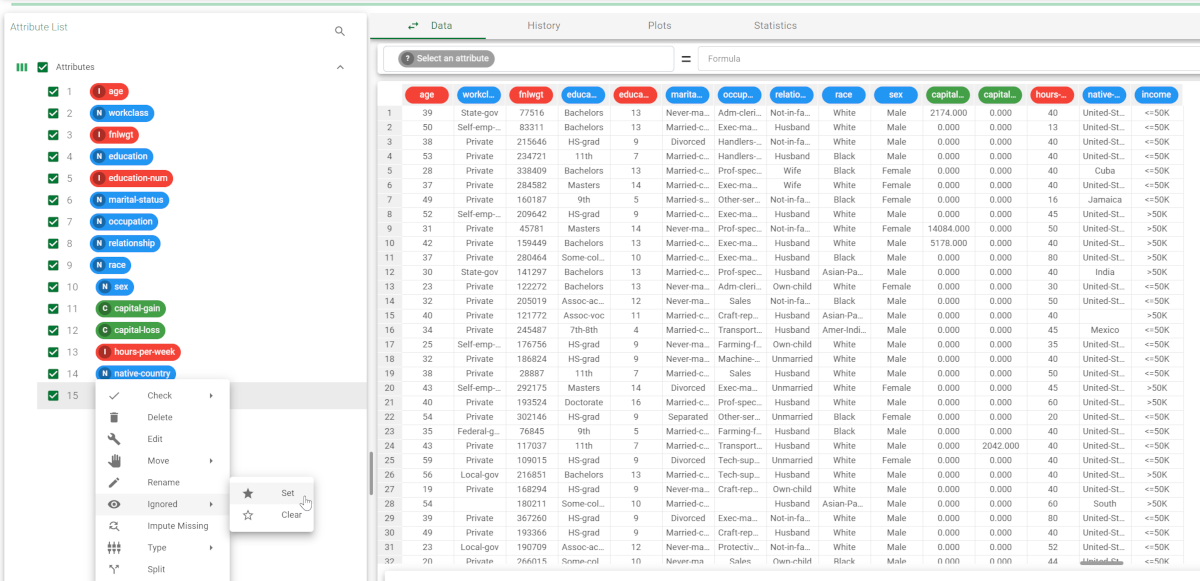 |
Add a Standard Clustering (K-means) task to the flow and configure it as follows:
| 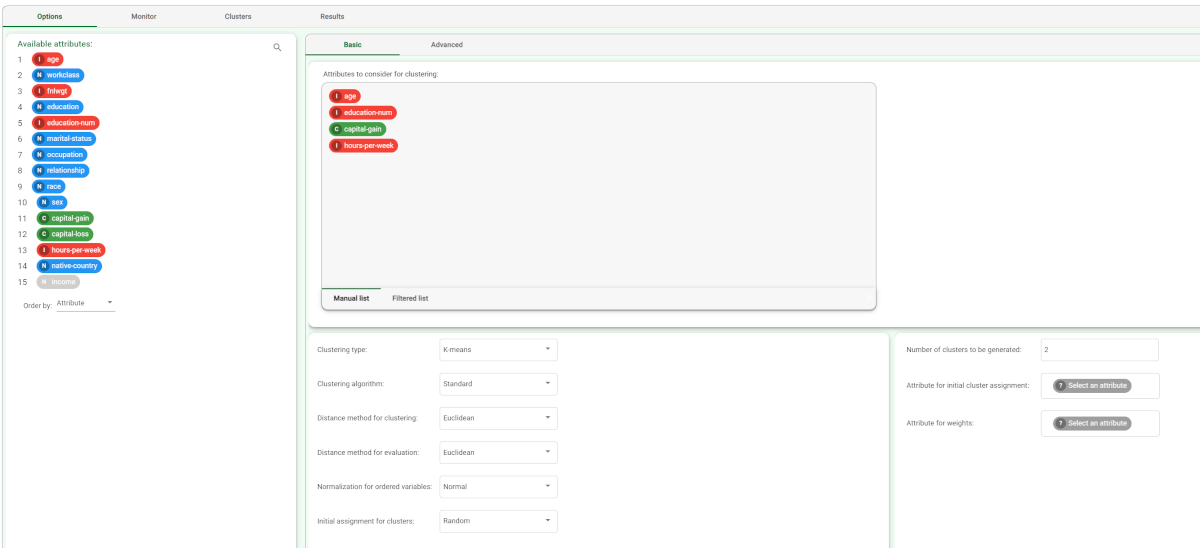 |
After clicking Compute to start the analysis, the properties of the generated clusters can be viewed in the Monitor tab of the Standard Clustering task. At the end of the computation the dispersion coefficients of the clusters are displayed. A similar histogram can be viewed for the number of elements, by opening the corresponding #Elements tab, as shown in the screenshot. Note that you can stop the process at any point by clicking the Stop computation button in the main toolbar. In this case, the last cluster subdivision is maintained and considered hereinafter. | 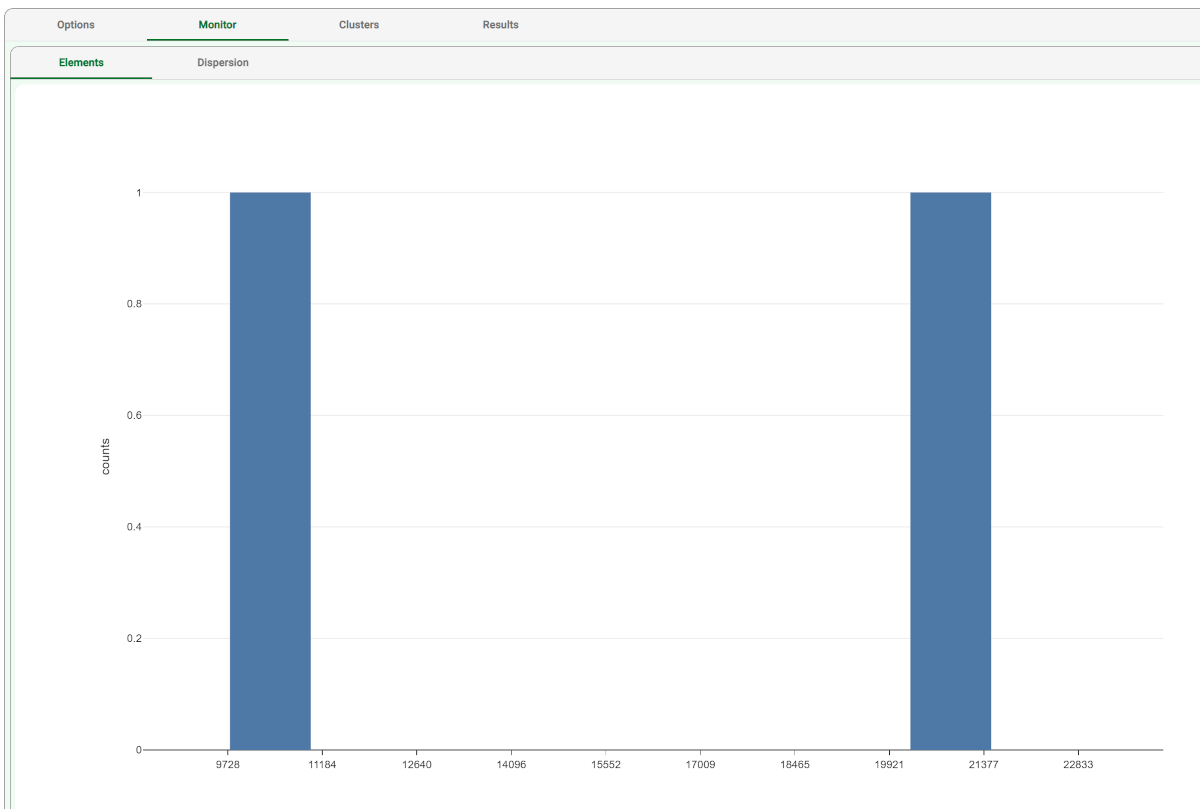 |
After the execution we obtain two clusters whose characteristics are displayed in the Clusters panel of the task. In each row of the spreadsheet the first columns contain the centroids for the clusters. The cluster column contains the progressive index of the cluster, whereas the columns nelem and disp give the number of elements and the dispersion coefficient, respectively. The last (third) row reports the values characterizing the default cluster, obtained by including in a single group all the elements of the training set. | 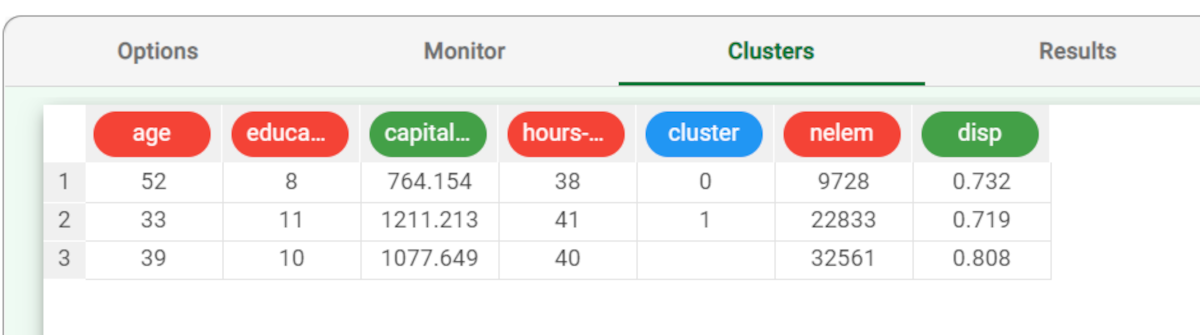 |
Clicking on the Results tab displays a summary of the computation performed, with:
| 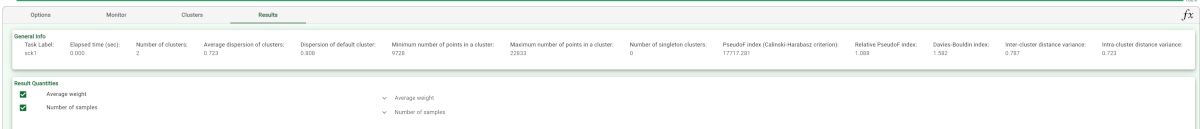 |
Add an Apply Model task to the flow to create the index of the cluster to which each pattern in the training and in the test set belongs. This is obtained by finding the nearest centroid (according to the Distance and Normalization options selected in the Option panel of the Standard Clustering task. Compute the task leaving its default settings. To view the results, right-click the Apply Model task and select Take a look. 32 additional result variables have been added to the dataset as can be seen in the final Data Manager task (dataman2). The first three result variables concern the cluster associated with the current pattern:
The subsequent 14 result variables report the values of the profile attributes for the centroid of the associated cluster: pred(age), pred(workclass), etc. The remaining 15 result variables concern the error performed when these values are employed as a forecast for the actual profile attributes of the pattern. In particular, the first of these result variables (error) provides the total error, whereas the others (err(age), err(workclass), etc.) give the error for each attribute. | 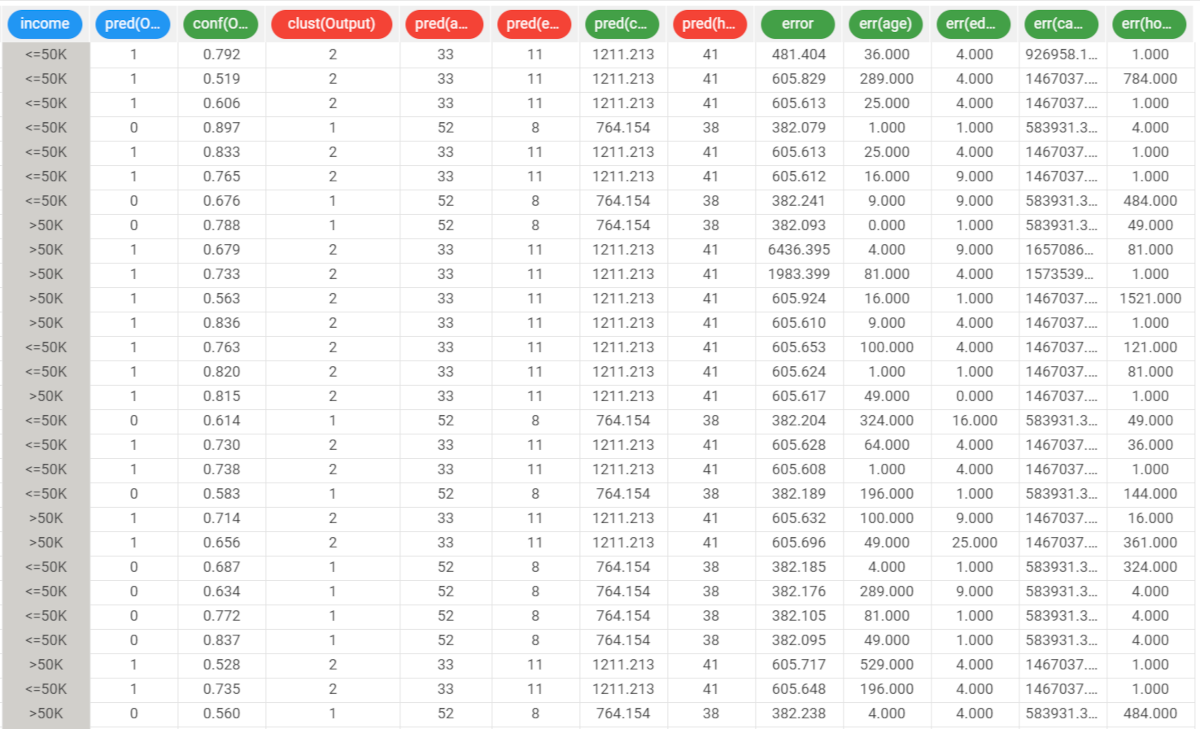 |