Using Anomaly Detection to solve Association Problems
The Anomaly Detection task extracts and characterizes anomalies from an event log, singling out the events in the flow which do not fit with any of the frequent sequences in the process model.
To perform this operation the task must receive an event log and the frequent sequences generated by the Sequence Analysis task. The task then provides a list of anomalies in output.
Prerequisites
you must have created a flow;
the required datasets must have been imported into the flow;
the data used for the analysis must have been well prepared.
frequent sequences have been generated in the process via a Sequence Analysis task
Additional tabs
The results of the Anomaly Detection task can be viewed in two separate tabs.
The Compressed frequent sequences tab displays the data resulting from the anomaly detection execution, where:
Frequent Sequence ID is the Sequential ID number for the frequent sequence.
Cardinality is the number of events constituting the frequent sequence.
Couple characterization is a qualitative characterization of the behavior for the sequence of two events A-B. Possible outcomes are:
Weak sequence - B is likely to follow A, A is indifferent to B,
Strong sequence - B is likely to follow A, A is unlikely to follow B,
Complements - B is likely to follow A and viceversa,
Substitutes - B is unlikely to follow A and viceversa,
Independents - B is indifferent to A and viceversa, or
Not enough information to determine.
#Occurrences is the number of times in which the sequence is retrieved in the data.
Confidences is the ratio of cases (0-1 value) in which, if the initial part of the sequence is verified, the final part follows. The first column of confidence is referred to the initial event, i.e. measures how often, if the initial event happens, the rest of the sequence follows. If a Maximum sequence cardinality higher than 2 is set, other columns are also generated, representing how often if the first two events are verified the other follow and so on.
All-confidence is the ratio between the number of occurrences of the whole sequence and the number of occurrences of the least frequent event included in the sequence.
Minimum time interval, Maximum time interval, Average time interval, Std time interval are the minimum, maximum, average and std interval of occurrences associated to the frequent sequence.
Event IDs are the IDs of the events that make up the frequent sequence.
The Results tab displays statistics on the task computation are displayed, where:
Task identifier is the ID code for the task, internally used by the Rulex engine.
Task name is simply the name of the task.
Elapsed time is the time required for latest computation (in seconds).
Number of different events in input is the number of distinct events which were fed to the task during latest computation.
Number of different sequences in input is the number of distinct sequences which were fed to the task during latest computation.
Number of detected anomalies is the number of events labeled as anomalies by the task.
Number of compressed frequent sequences is the number of frequent sequences which constitute the model, after the compression step performed by the task.
Procedure
Drag the Anomaly Detection task onto the stage.
Connect a Sequence Analysis task to the new Anomaly Detection task.
Double click the new task to open it. The left-hand pane displays a list of all the available attributes in the dataset, which can be ordered and searched as required.
Configure the basic options, as described in the table below.
Click on the Compressed tab to configure the advanced compression options, as described in the table below.
Save and compute the task.
Anomaly Detection Basic options | |
Name | Description |
|---|---|
Time attribute | Select the attribute that contains the timestamp for events. |
Label also early events as anomalies | If selected early events are labeled as anomalies. This may happen when one event is detected shortly after the event preceding it in the sequence, earlier than the minimum time span between those events predicted by the model. |
Append results | If selected attributes generated by the tasks will follow current result attributes, otherwise current result attributes will be overwritten. |
Sequence key attributes | Drag and drop the nominal attributes which will be used to identify sequences from the Available Attributes list to this list. Instead of manually dragging and dropping attributes, they can be defined via a filtered list. |
Event key attributes | Drag and drop the nominal attributes which will be used to characterize events from the Available Attributes list to this list. Instead of manually dragging and dropping attributes, they can be defined via a filtered list. |
Anomaly Detection Compressed options | |
Model compression method | Select how you want to compress the frequent sequences model to single out anomalies from the drop-down list:
|
All-confidence threshold for sequences of dimension 2 | If the All-confidence based filter has been selected as the compression method above, select the value which determines if a sequence should be discarded or not. |
Only compress sequences | If selected, sequences will be compressed, but no anomaly detection will be performed. |
Example
The following example uses the san-test dataset.
Description | Screenshot |
|---|---|
After having imported the san-test dataset, add a Reshape to Long task, as each row of the dataset represents a sequence, composed by Sequence ID, the date of occurrence, and a variable number of Event IDs. Configure the Reshape to Long task as follows:
Leave the other options as default and save and compute the task. | 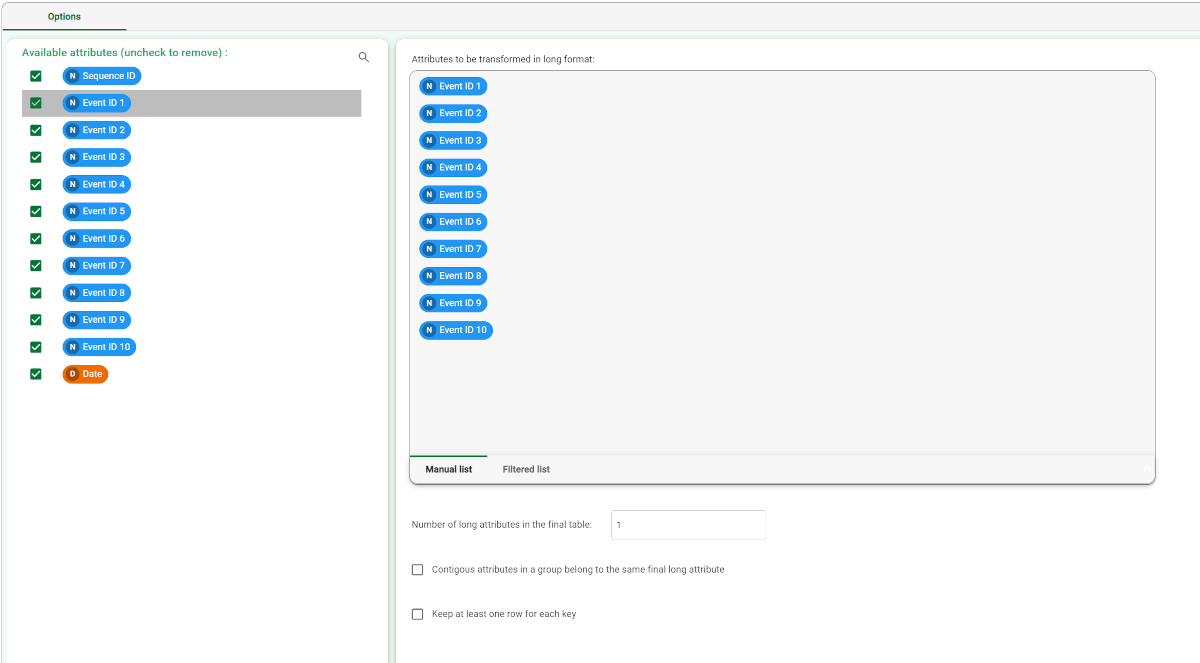 |
Then, we connect the Sequence Analysis task to the Reshape to Long task. Configure the task as follows:
| 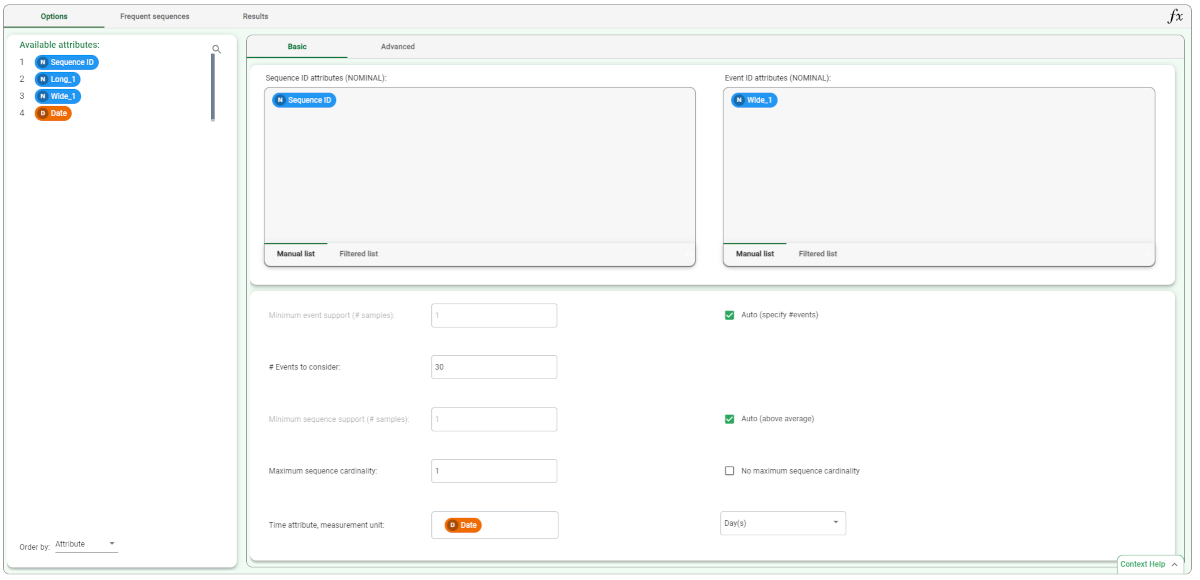
|
Save and compute the task. The extracted frequent sequences can be seen in the Frequent Sequences tab. | 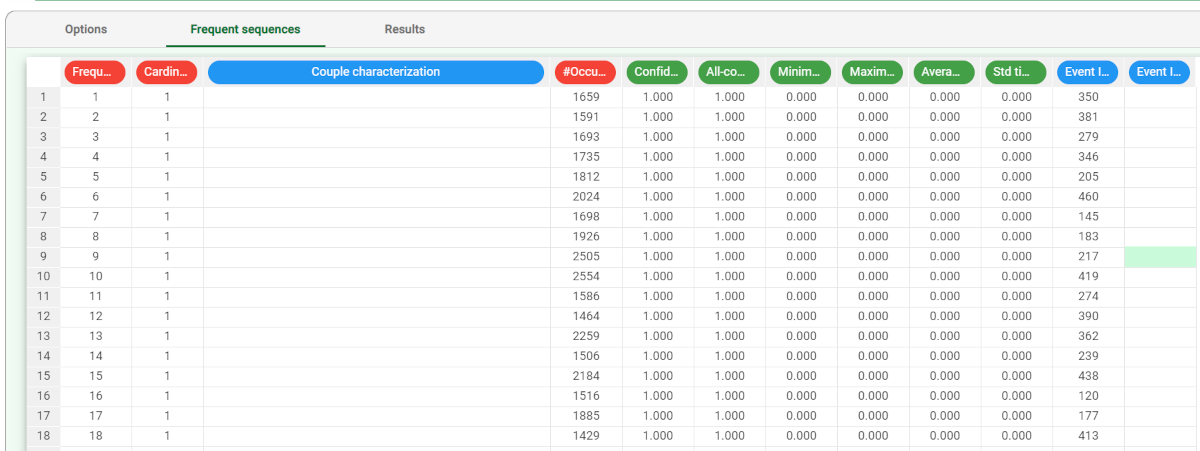 |
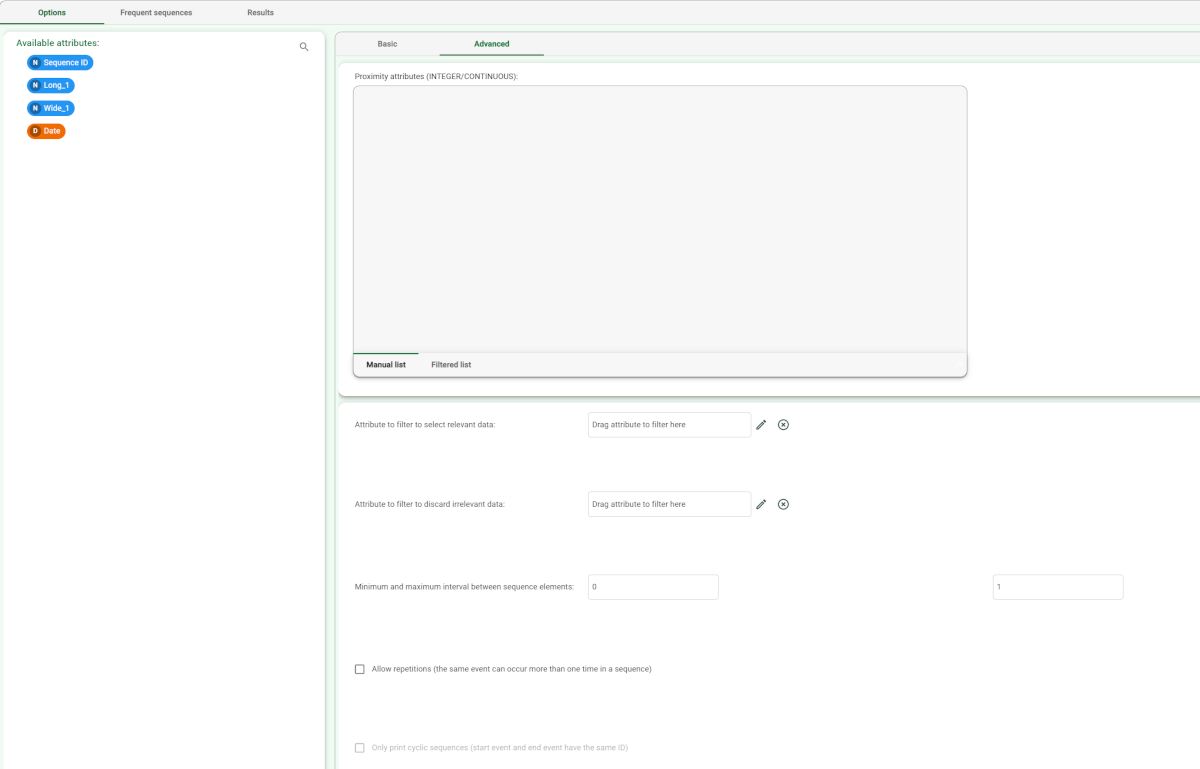
Now we connect the Anomaly Detection task to the Sequence Analysis task, and configure it as follows:
|  |
In the Compression tab of the Options panel, select Closed frequent sequences as Model compression method. Save and compute the task. | 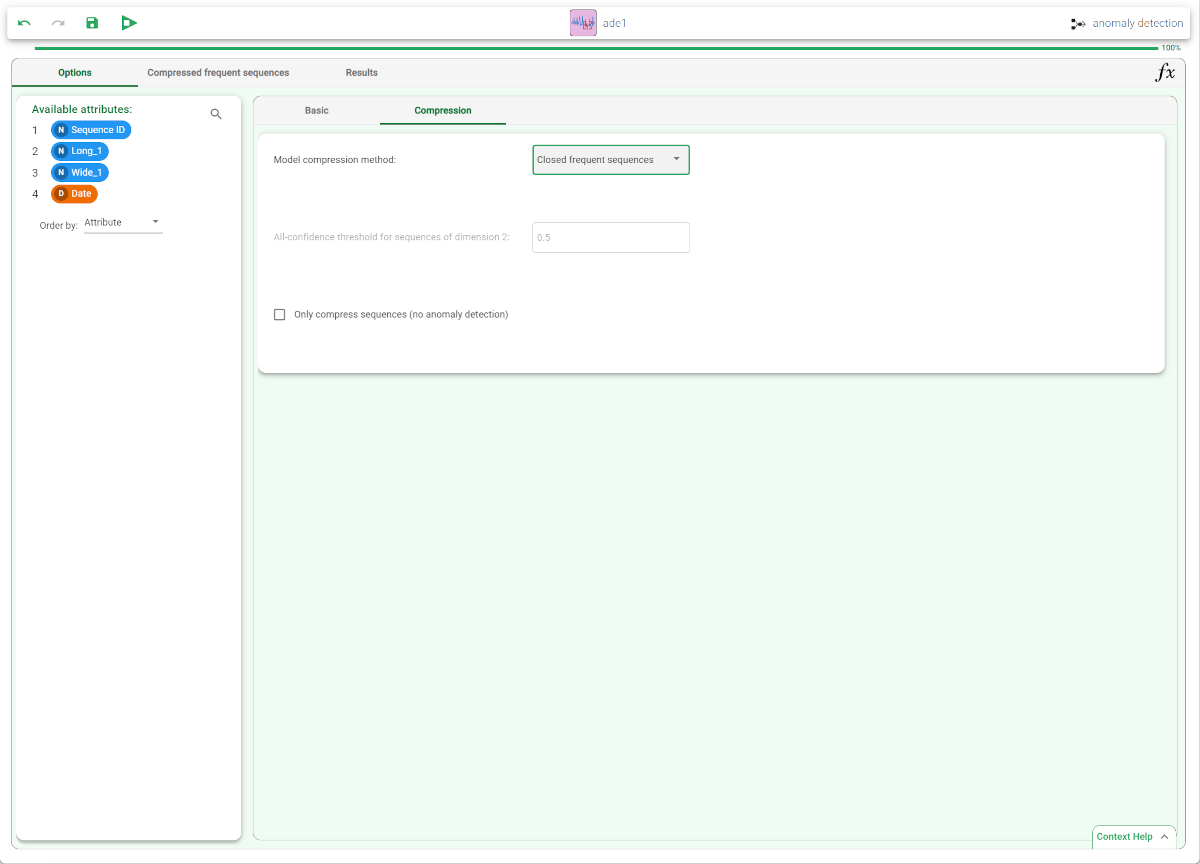 |
To check the results of the computation, right-click the task in the process and select Take a look. Alternatively, you can link a Data Manager to the task. Supplementary attributes, generated by the Anomaly Detection task, have been generated, allowing us to determine if, with respect to the considered model, the event is an anomaly. For each anomalous event, if previous events constituting an incomplete frequent sequence involving it were detected, their IDs are printed in the Detected Event column(s) and the one which should be next is included in the Missing Event column. The timeout period after which the missing event was not detected is stored in the Timeout column. Otherwise, if the event is anomalous by itself, i.e. if it is not frequent enough to be included in the (compressed) frequent sequences model, the Detected event column is filled with the ID of the event itself, and both the Timeout and the Missing Event columns are left blank. | 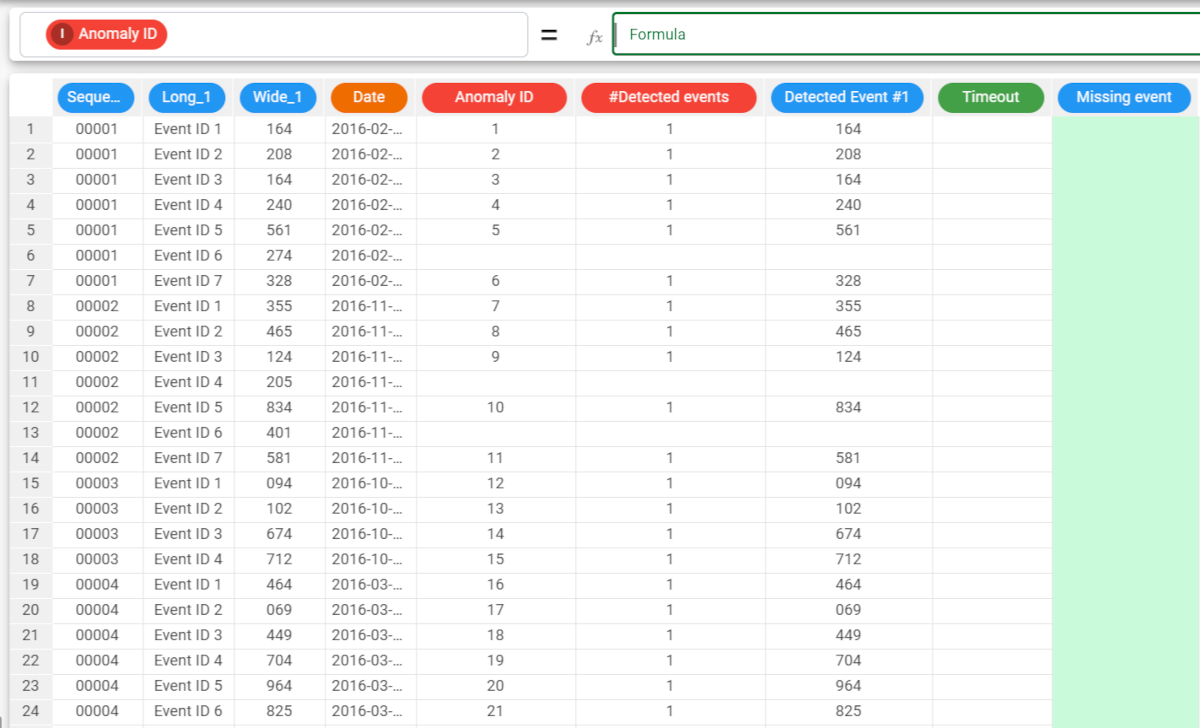 |