Analyzing Flow Performance
When a flow is computed in Rulex, it may be useful to understand how much time was required by each individual task in the flow to load, run and store data.
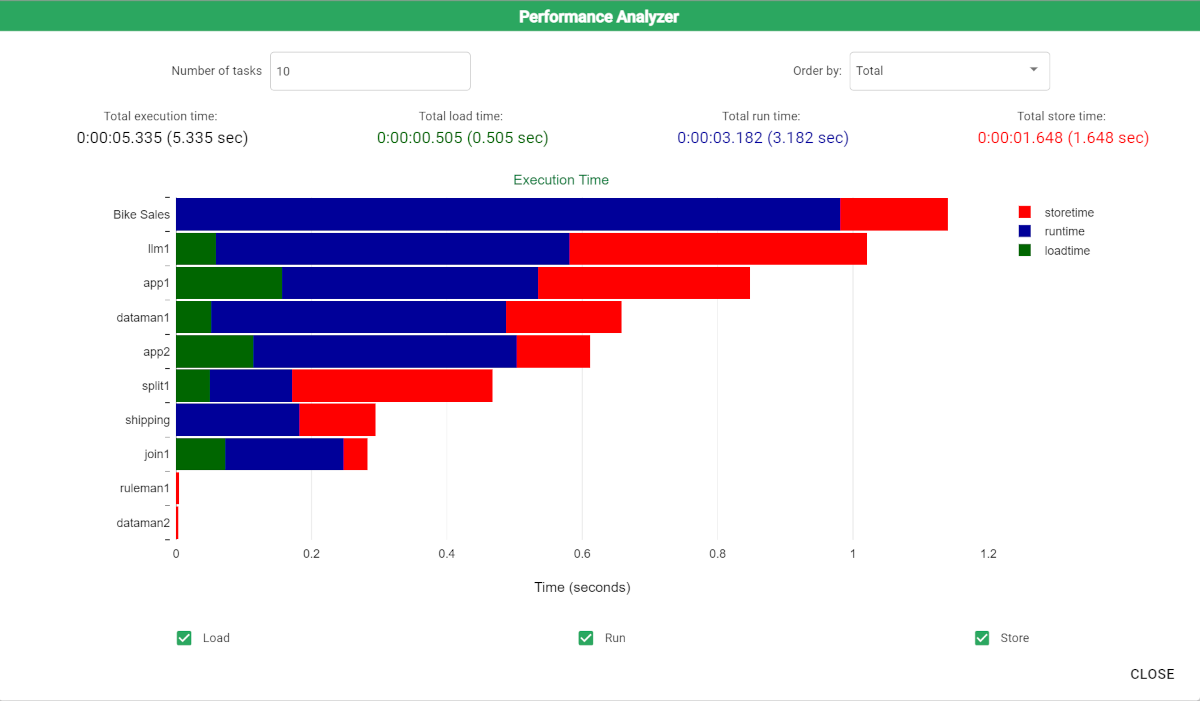
The Performance Analyzer task allows you to easily understand the time distribution of a flow computation, divided by task and task type.
The last 10 tasks in the flow are displayed by default, but you can modify this number.
The total time summaries (Total execution time, Total load time, Total run time, Total store time) refer to the whole flow, and not just the tasks included in the graph.
Prerequisites
you must have created a flow.
Procedure
Click the Performance Analyzer button in the flow’s toolbar.
If required, modify the number of tasks included in the graph. By default the last 10 tasks are displayed.
In the Order by drop down list, select how you want to order the graph. Options are:
Total - to display the tasks according the their overall length;
Load - to display the tasks according the time they took to load data;
Run - to display the tasks according the time they took to execute;
Store - to display the tasks according the time they took to save and store data.
Click Close to return to the main screen.
Example
The following graph shows the last 9 tasks in the flow, ordered by the time they took to save and store data.
Each task displays the time it took to store, run and load data.