Applying functions in the Data Manager
Through the Apply option, you can apply basic statistical functions, such as averages, entropy and variance to the attribute values in the selected columns to your attributes, based on their type.
There are several icons displayed in the Apply area, which are useful to understand before performing this operation:
The function type icon: it displays the acronym of the function currently applied to the corresponding attribute.
Make persistent: located on the right side of the query panel. Click on it to effectively apply all the query operations and permanently change the dataset.
Clear: located on the right side of the query panel. Click on it to clear the query table, removing all the created query operations, performed since the last time Make persistent was selected, and their effects to the dataset.
Prerequisites
You must have created a flow;
You must have linked the Data Manager to a task which contains the data to work on.
Procedure
Drag the attributes onto the Apply area.
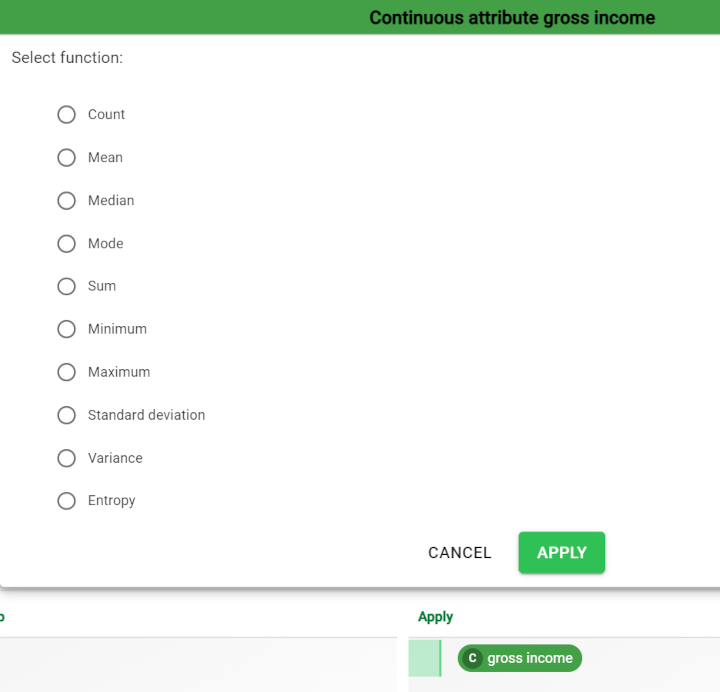
Select the required function (see details on available functions in the table below the procedure).
Click Apply.
Click either:
Make persistent button to save your results and make all the query operations permanent.
The pre-filter cell is automatically cleared from the query operations performed, but the query operations are still applied to the table.Clear to remove query operations from the query panel: it cancels all the query operations that haven’t yet been made persistent.
Save and compute the task.
Here is a list of the functions available in the Apply box: they depend on the attribute type.
Function | Purpose |
|---|---|
Mode | It displays the most frequent value. |
Mean | It displays the mathematical average of the values. |
Number of distinct | It displays the number of non-coincident values. |
Minimum | It displays the minimum value for the attribute (or the nominal attributes are put in alphabetical order A-Z). |
Maximum | It displays the maximum value for the attribute (or the nominal attributes are put in alphabetical order Z-A). |
Entropy | It measures the randomness of data:
|
Sum | It sums the values. Not available for nominal attributes. |
Standard deviation | It measures the variability of values, by displaying how far values deviate from the mean average value. Not available for nominal values. |
Variance | It’s the standard deviation’s quadratic value. |
Median | It displays the median attribute value (middle). E.g.: 1; 2; 3; 4; 5; 3 is the median value. Not available for nominal attributes. |
Count | It counts the values in the attribute. |
Example
The following example uses the Supermarket_sales dataset.
Step | Screenshot |
|---|---|
Drag the attribute onto the Apply area. | |
| |
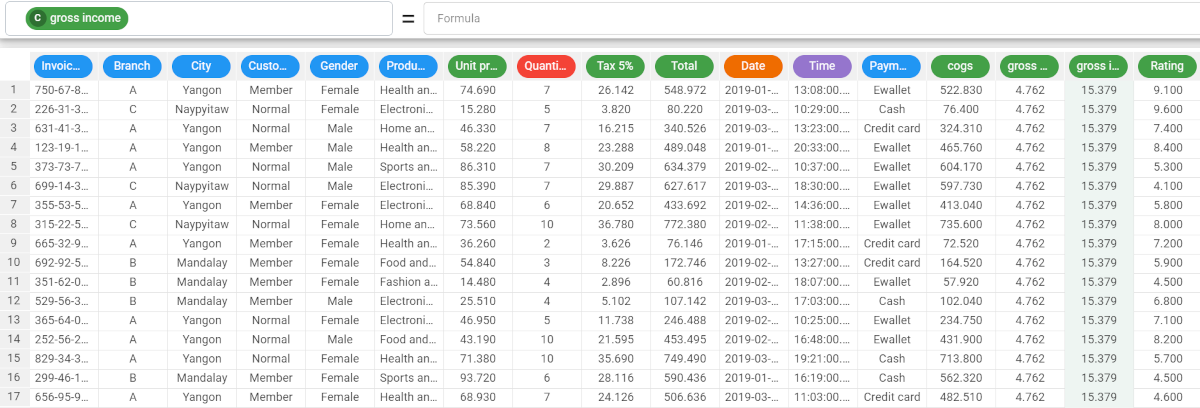
Click Make Persistent and save and compute the task. |


