Updating Plots After Query Operations
As previously said, the Plots tab of the Data Manager allows you to build multiple plots which help displaying graphically the dataset’s features.
Plots are saved upon Data Manager’s computation, and they don’t need to be built again after computation operations.
Performing query operations after the plot has been built
If you need to apply functions or to perform query operations on the dataset and you want to update the plot, you have two options:
you can build a new plot with the updated attributes, so you can make comparisons with the previous data situation.
you can update the existing plot by right-clicking on the plot and selecting Refresh Plot.
Example 1 - building a new plot with updated results
The following example uses the Adult dataset.
The following steps were performed:
The dataset has been imported into the flow.
A Data Manager has been linked to the import task.
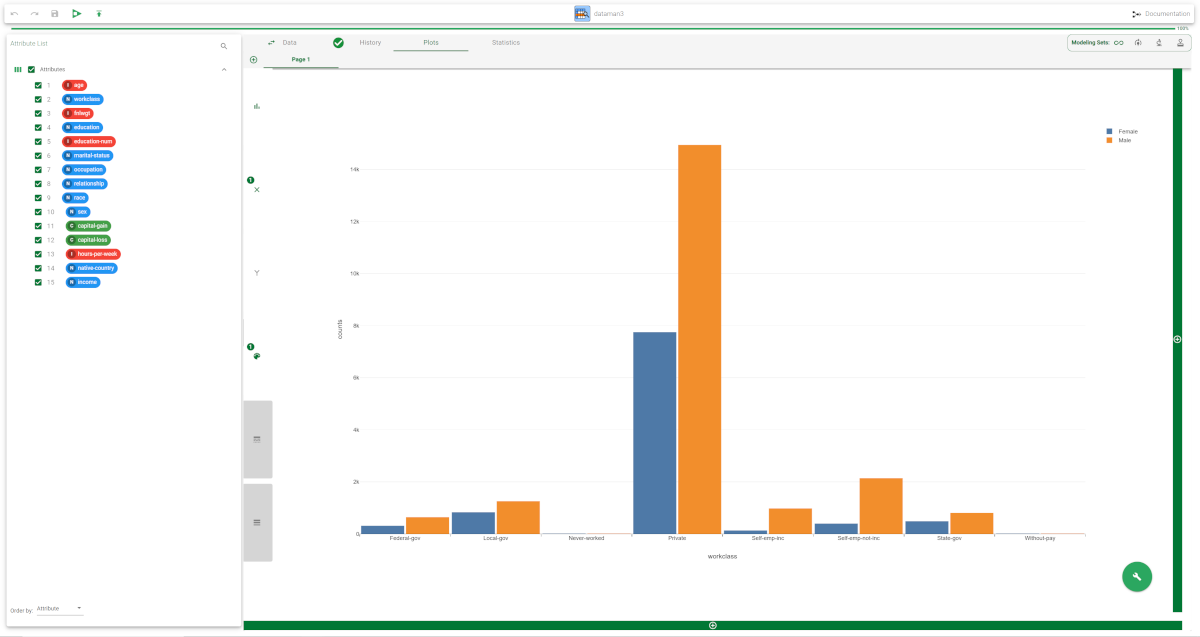
A bar plot with the workclass attribute on the X and the sex attribute on the color has been built.
The task has been saved and computed.
Description | Screenshot |
|---|---|
In the Data tab, drag the workclass attribute onto the Pre-filter area and uncheck the following values:
Then, click Apply. | 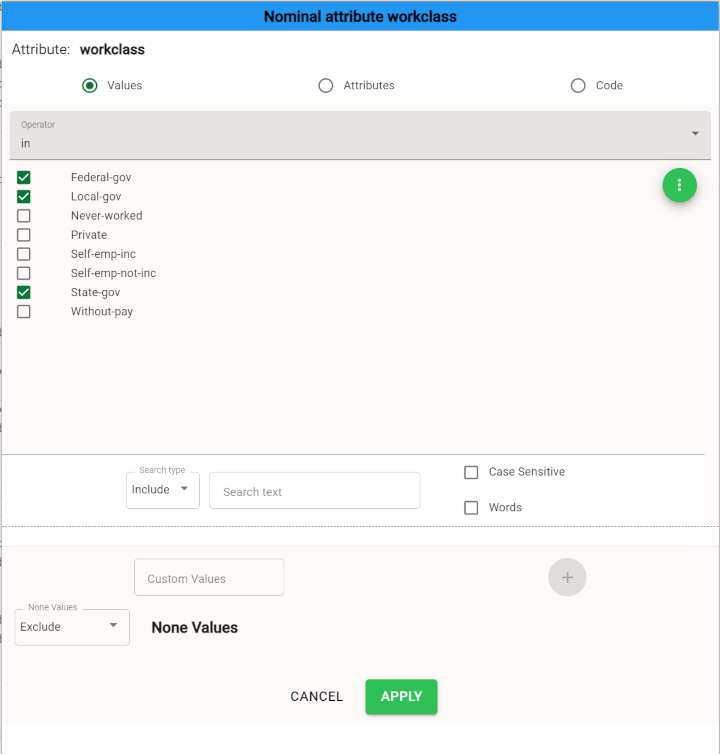 |
Then, drag the age attribute onto the Pre-filter area and filter all the values >45. Click Apply. | 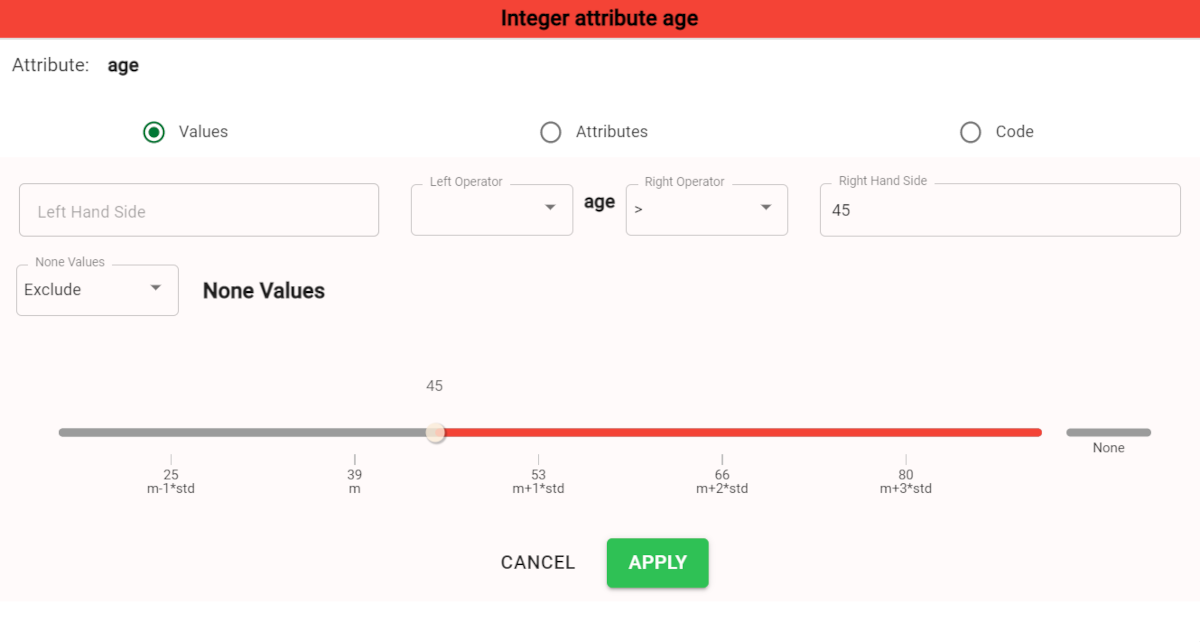 |
Then, go to the Plots tab and add a new plot by clicking on the plus button under the existing plot, so that they are placed vertically. Alternatively, you can build it next to the existing plot by clicking on the plus button on the right of it. Drag the workclass attribute on the X and the sex attribute on the color. Now the values are displayed, considering the filter operations performed. | 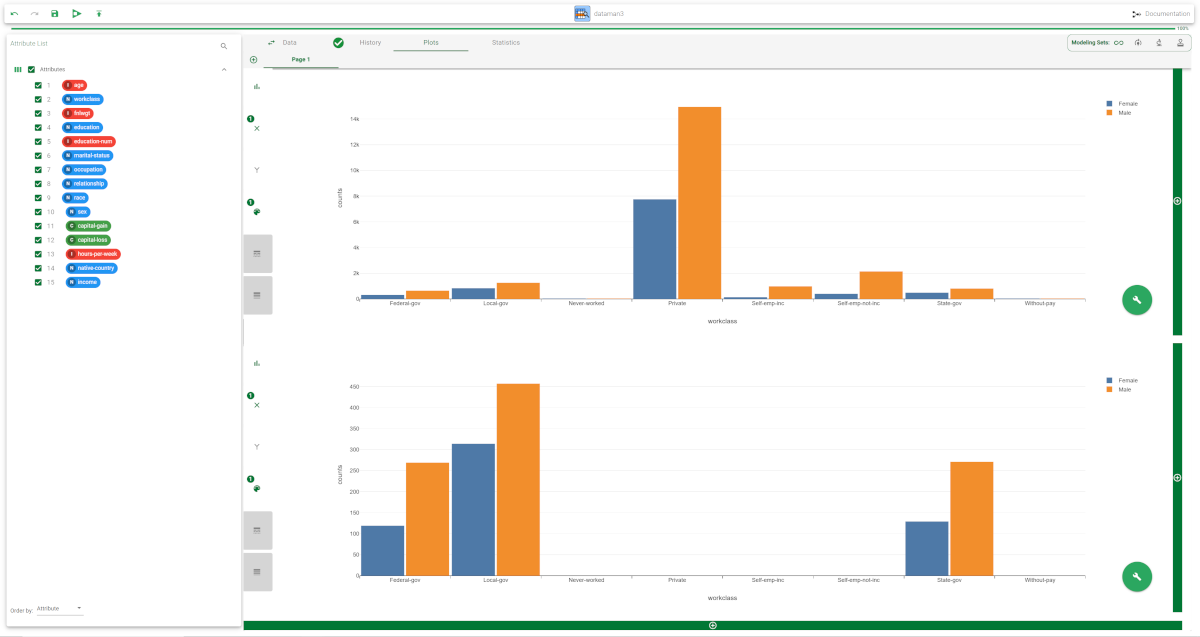 |
Example 2 - the Refresh Plot option
The following example uses the Adult dataset.
The following steps were performed:
The dataset has been imported into the flow.
A Data Manager has been linked to the import task.
A bar plot with the workclass attribute on the X and the sex attribute on the color has been built.
The task has been saved and computed.
Description | Screenshot |
|---|---|
In the Data tab, drag the workclass attribute onto the Pre-filter area and uncheck the following values:
Then, click Apply. | |
Then, drag the age attribute onto the Pre-filter area and filter all the values >45. Click Apply. | |
Then, go to the Plots tab. As in this case we don’t need the old plot, right-click onto the plot and click Refresh Plot. The plot is updated according to the dataset. | 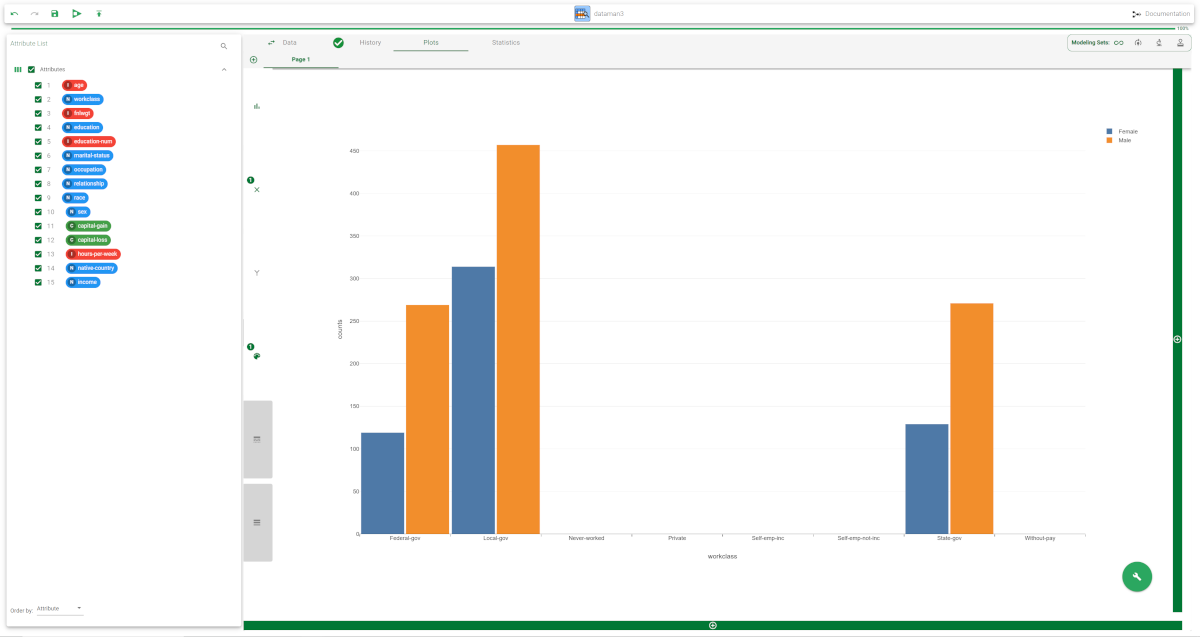 |