Plotting Box Plots in the Data Manager
A Box Plot is a graphical representation based on the minimum, first quartile, median, third quartile and maximum value of a quantitative data set.
It contains the following elements:
Attribute | Mandatory | Constraints |
|---|---|---|
x | No | |
y | Yes | It cannot be a nominal value. |
color target | No |
Customization constraints If you drag a second attribute on an element of an existing plot, the first attribute is replaced by the new one; If you drag a second attribute on an element of an existing plot, hold down the CTRL button on your keyboard when dropping the second attribute to create another plot with the new attribute on the chosen element. If you drag a second attribute on an element of an existing plot, hold down the SHIFT button on your keyboard when dropping the second attribute to add the second attribute to the same plot, so that one element will contain two attributes. To know more about the plot’s elements, go to the Elements page.
You can decide to separate the attributes onto two different plots, by right clicking on the attribute and selecting Detach. If you want to merge the two attributes again, right click on the second attribute and select Attach.
Example
The following example uses the Adult dataset.
Description | Screenshot |
|---|---|
Drag the age attribute onto the y element. The box plot displays the middle values of a variable (included between the first and the third quartile, and the inner line indicates the median), The whiskers stretch to the values corresponding to three times the standard deviation above/below the mean. Any external points are considered outliers and are shown individually. | 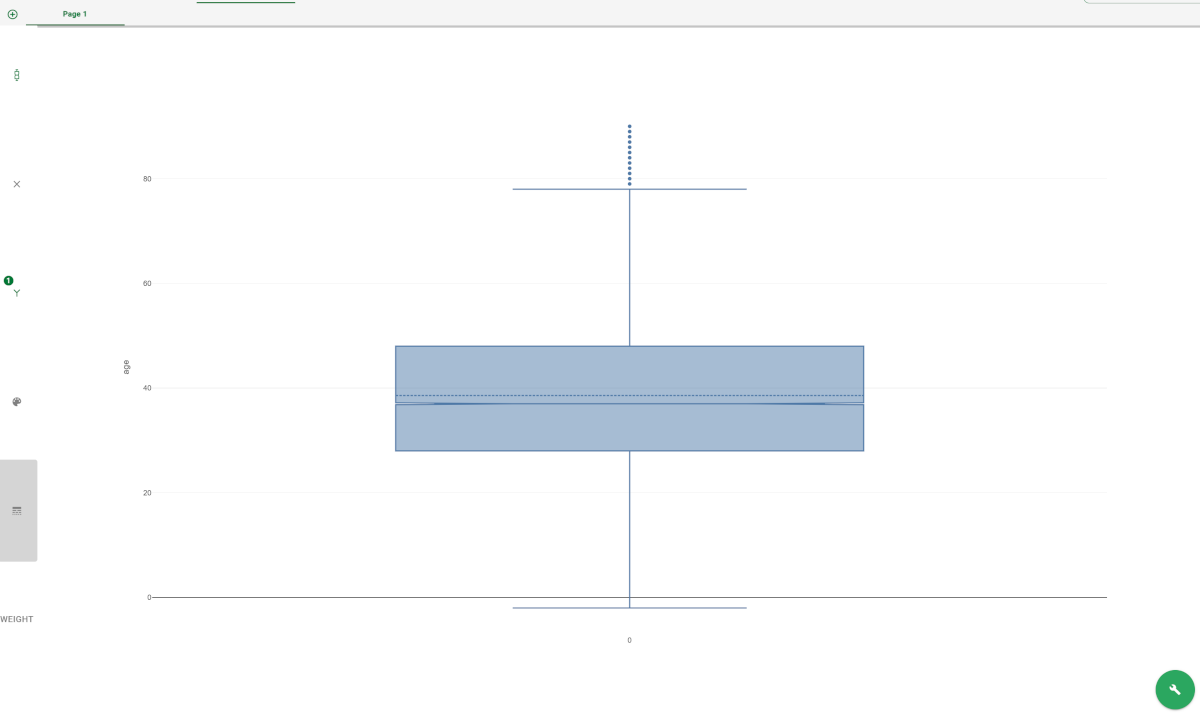 |