Managing Attribute Values
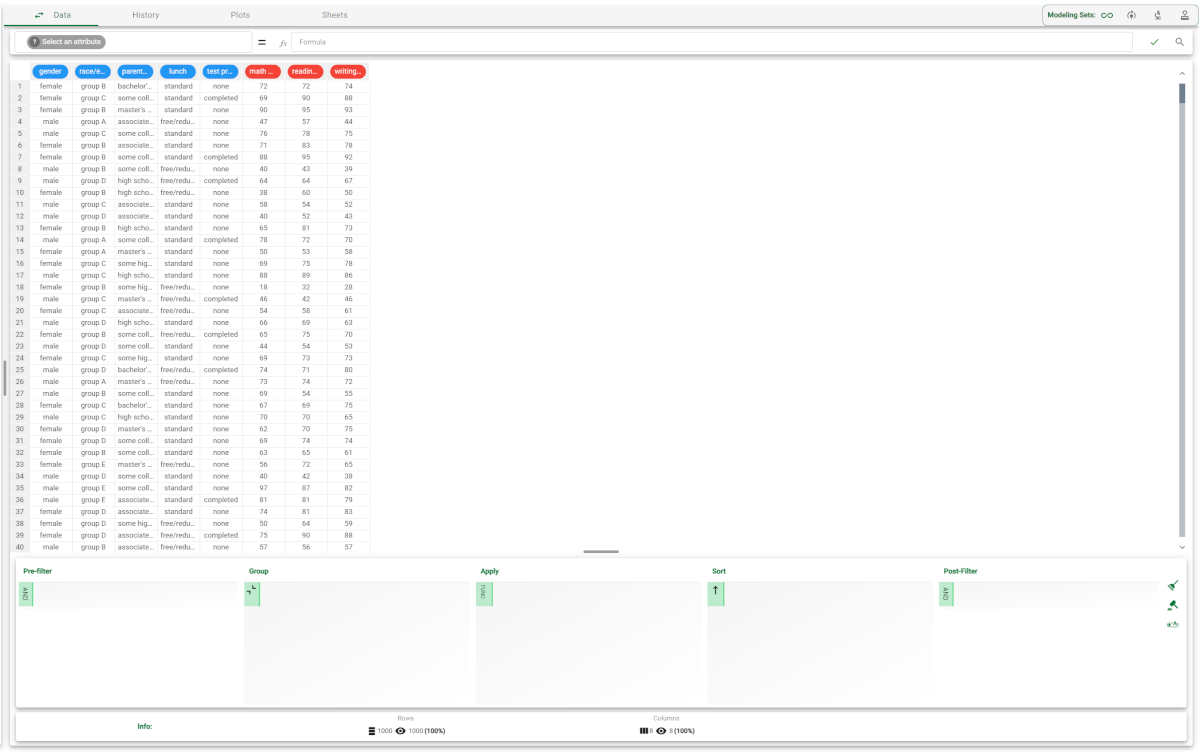
The Data tab in the Data Manager task displays the dataset in a spreadsheet format.
The following operations can be performed in this tab:
Name | Description |
|---|
Attribute | The name of the selected attribute is displayed. You can choose it by directly clicking on it or by choosing it in the drop down list. |
Formula bar | You can write the formula to apply to the selected attribute. |
Column headers | The column headers display the name of the attribute. The following operations can be performed by right-clicking on the column header: Sort columns in ascending or descending order. This operation automatically adds the attribute to the Sort column of the Query Manager. Copy the formula applied to the selected column and apply it to other columns by pasting the formula.
|
Data table | The data table is structured like a spreadsheet. The following operations can be performed on the table: Edit each single cell by double-clicking on it and entering the new value. Any corresponding statistic operation, such as the average of the column, is automatically updated. Note that if the column contains nominal data, you don't need to add double quote marks when entering a new value. Reference specific cells coming from the Sheets tab by using the following syntax in the formula bar: this feature is very useful if you want to compare statistics coming from different attributes.
The following operations can be performed by selecting and right-clicking cells: Change the values of a single or multiple cells (Set value). Add attributes: clicking on it will add one or more attributes next to the selected one. Set your preferences in the Add Attribute Panel. Delete attributes: clicking on it will delete the selected attribute. Sort ascending: the values of the selected attribute will be sorted in ascending order. If you have a nominal attribute, the values will be sorted in alphabetical order A-Z. Sort descending: the values of the selected attribute will be sorted in descending order. If you have a nominal attribute, the values will be sorted in alphabetical order Z-A. No sort: this option rolls back the sorting operations performed. scroll down to a specific row (Go to row), which may be useful when the dataset contains many rows.
The following operations can be performed by right-clicking on the row number on the spreadsheet: Set value: you can set a value for the whole selected row. Add rows: you can add as many rows as you choose to the dataset and set their characteristics, like placing them before or after the selected row. Delete rows: you can delete the selected rows. scroll down to a specific row (Go to row), which may be useful when the dataset contains many rows.
|