standard deviation function in the Factory
The standard deviation is a statistical function which measures the dispersion of a dataset relative to its mean, and it is the square root of the variance.
The higher the standard deviation, the furthest the values are far from the expected standard value.
The standard deviation is also available by:
Dragging the attribute in the Apply area of the Data Manager’s query panel.
Selecting it in the Sheets tab of the Data Manager.
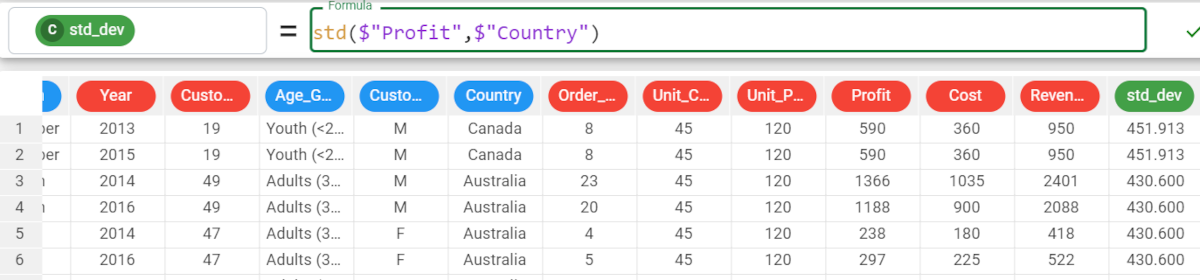
Function and parameters Parameter Description column It identifies the column to which you want to apply the formula. The column parameter is mandatory. group It allows you to group the results by a certain column. Example The following example uses the Bike sales dataset. Description Screenshot In the example here, we want to retrieve the standard deviation of the Profit attribute. We add a new attribute and we write the following formula: If we want to be more precise with our analysis, we can add the group parameter. Here we want to group the results by the Country values, so the formula will be: The results are as follows: The standard deviation for the Profit in Canada is 451.913. The standard deviation for the Profit in Australia is 430.600.std(column, group)std($"Profit")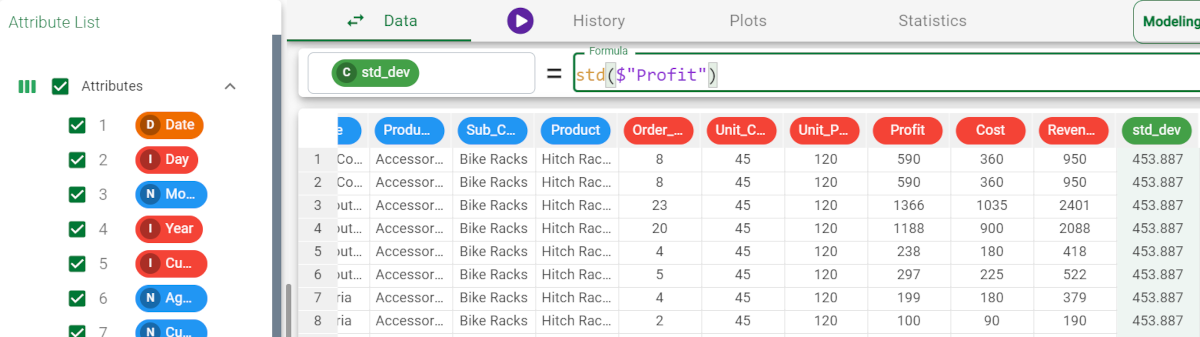
std($"Profit",$"Country")