pearson function in the Factory
The pearson function returns the Pearson coefficient between column1 and column2, evaluated within groups defined by the group parameter if required.
The pearson coefficient represents the relationship between two continuous variables.
The Pearson coefficient ranges from -1 to +1, where:
-1 represents a negative correlation, and
+1 represents a positive correlation.
The Pearson function is available also by selecting it in the Sheets tab of the Data Manager.
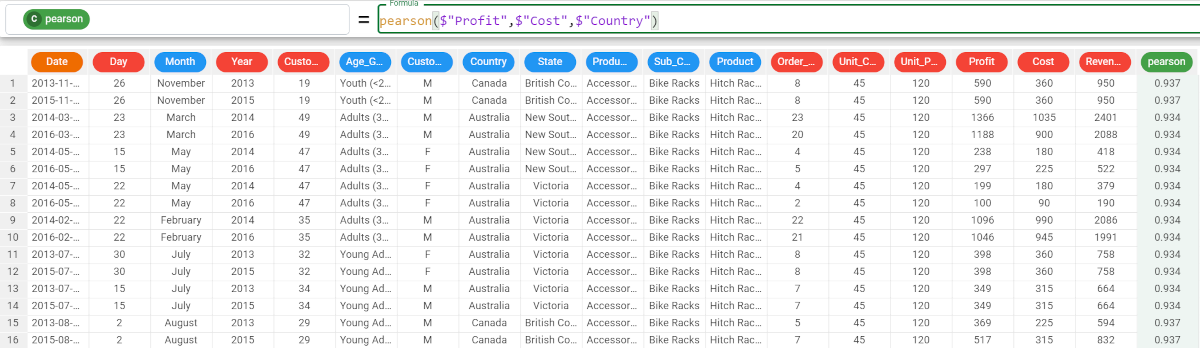
Function and parameters Parameter Description column1 It identifies the first column to which you want to apply the formula. The column1 parameter is mandatory. column2 It identifies the second column to which you want to apply the formula. The column2 parameter is mandatory. group It allows you to group the results by a certain column. Example The following example uses the Bike Sales dataset. Description Screenshot In the example here, we would like to retrieve the Pearson coefficient between the Profit and Cost attributes. We write the following formula: The value of the Pearson coefficient is 0.902, so the result is considered positive. If we want to go further with our analysis, we can group our results by a specific attribute values. In the example here, we decided to group out results by the Country attribute, so the formula becomes: The results are as follows: The Pearson coefficient between the Cost and Profit in Canada is 0.937; The Pearson coefficient between the Cost and Profit in Australia is 0.934, and so on.pearson(column1, column2, group)pearson($"Profit",$"Cost")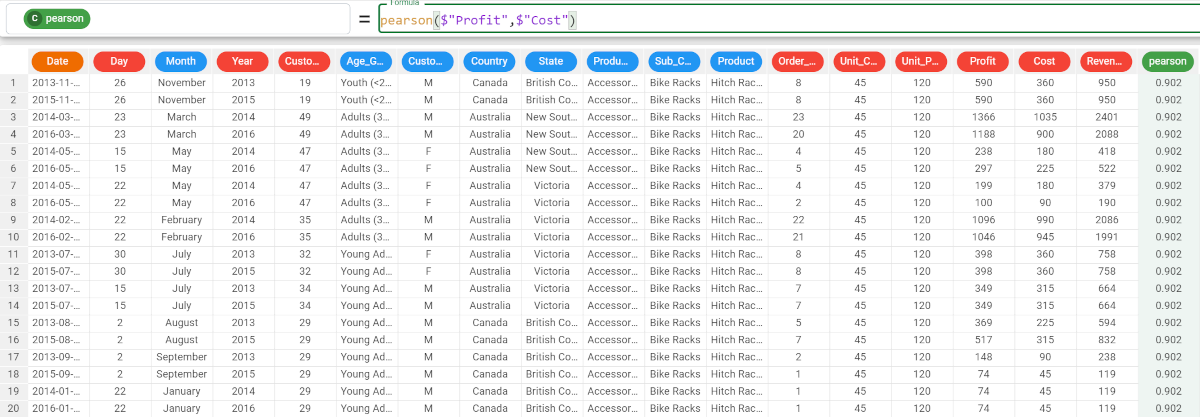
pearson($"Profit",$"Cost",$"Country")