covariance function in the Factory
Covariance is a measure of how changes in one variable are associated with changes in a second variable.
Although it measures the relationship between two variables, it is an absolute measure, not a normalized one, so giving them a quantitative meaning is very difficult. Its corresponding normalized measure is the correlation.
A positive value indicates a positive covariance, while
A negative value indicates a negative covariance.
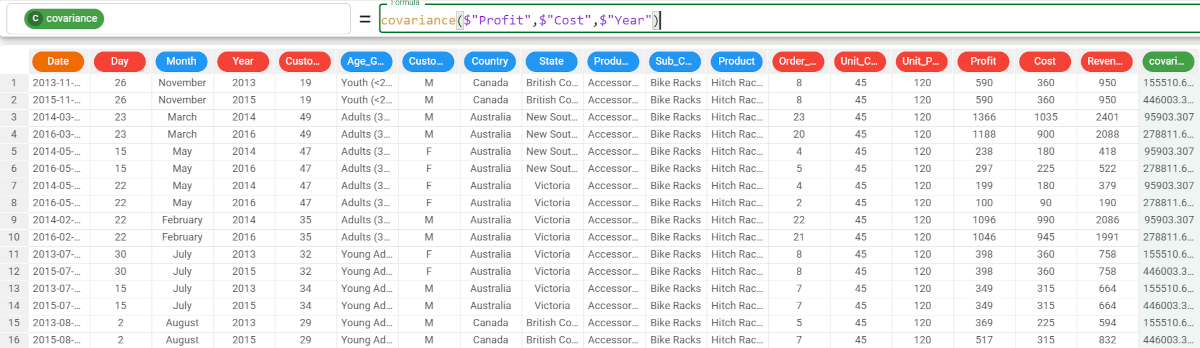
Parameters Parameter Description column1 The first attribute you want to use in the function. The column1 parameter is mandatory. column2 The second attribute you want to use in the function. The column2 parameter is mandatory. group The attribute by which you want to further group results. Example The following example uses the Bike-sales dataset. Description Screenshot In this example, we want to retrieve the covariance between the profit and cost attributes. We type the following formula: We want to go further with the analysis, and group our results. In this case, we want to group our values by the Year attribute. The formula will be: The results can be read as follows: For 2013, the covariance between the Profit and the Cost is 155510.629; For 2015, the covariance between the Profit and the Cost is 446003.342; and so on. In this example, the covariance between the values is positive, so it displays that, as the Profit value increases, the Cost value tends to increase and vice versa.covariance(column1, column2, group)covariance($"Profit",$"Cost")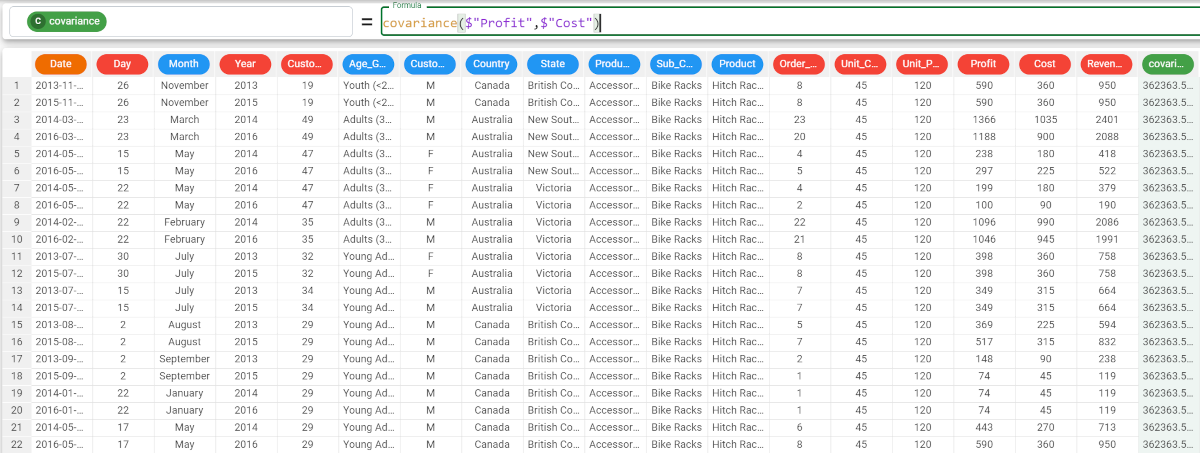
covariance($"Profit",$"Cost",$"Year")