chisquare and chisquarep functions in the Factory
The chisquare functions determine whether there is a correlation between two nominal variables, and evaluates whether the results are sufficiently reliable.
The null hypothesis states that there is no statistically-significant relationship between two variables in a hypothesis, whereas the alternative hypothesis states the opposite, i.e. that there is a statistically-significant relationship between the variables.
chisquare() determines whether the null hypothesis is true or not. A high value indicates that the variables are independent (so the null hypothesis is true), a low value indicates the opposite (so the alternative hypothesis is true).
chisquarep() compares the null hypothesis, which assumes the variables are totally independent, to the results obtained by analysing the data (the alternative hypothesis), to evaluate the reliability of the correlation. The result is a coefficient, which indicates the lowest level of significance at which the null hypothesis of the coefficient would be rejected. Values can range between 0 and 1, where low values below 0.05 indicate that there may effectively be a correlation between the variables, whereas higher values indicate that the results are probably due simply to chance, and cannot consequently be considered reliable. This value is particularly important to consider when the dataset has a limited number of samples.
The chisquare statistic is also available in the Sheets tab of the Data Manager.
In the Sheets tab, the chisquare results are graphically displayed in a contingency table, which shows the frequency distribution of the values of the selected attributes.
Parameters for chisquare and chisquare p Parameter Description column1 The first nominal attribute you want to use in the function. If it is not nominal, it will be casted to nominal upon function’s computation. The column1 parameter is mandatory. column2 The second nominal attribute you want to use in the function. If it is not nominal, it will be casted to nominal upon function’s computation. The column2 parameter is mandatory. group The attribute by which you want to further group results. If the column1 and column2 parameters are already a list, the group parameter is ignored. usemissing A Boolean which indicates whether missing values should be considered or not in the computation of the statistics. The default value, if not otherwise specified, is True.chisquare(column1, column2, group, usemissing)chisquarep(column1, column2, group, usemissing)
Example - chisquare
The following example uses the HR employee attrition dataset.
Description | Screenshot |
|---|---|
In the example here, we want to retrieve the chisquare statistic of the Education Field and Job Role attributes, to understand if there is a correlation between education and job roles for the samples in the dataset. We write the formula | 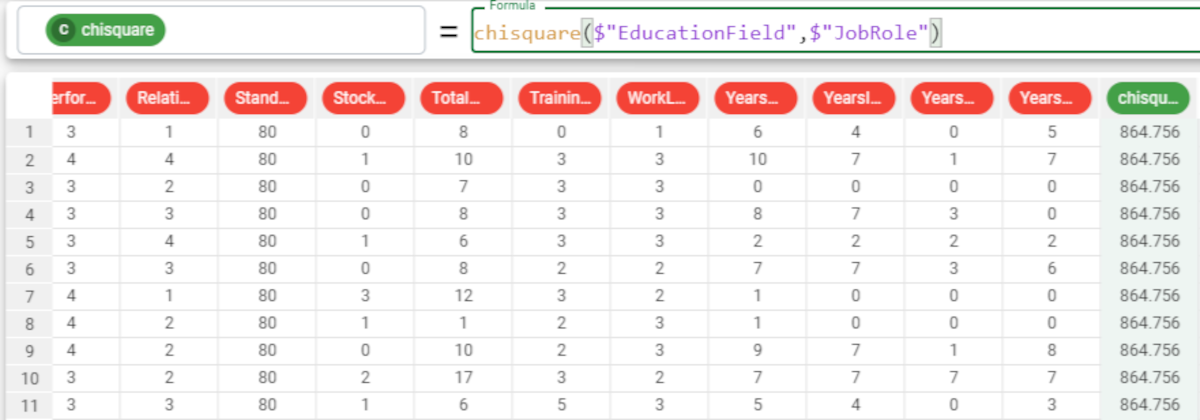 |
If we want our results to be grouped by another attribute, we simply add the attribute name to the formula. So our formula will be: As we can see, the results have changed:
| 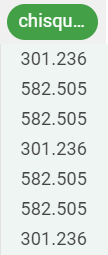 |
Example - chisquare p
Description | Screenshot |
|---|---|
In the previous example we have calculated the chisquare statistics. Now we would like to go further and check the reliability of the retrieved chisquare. We write the formula: | 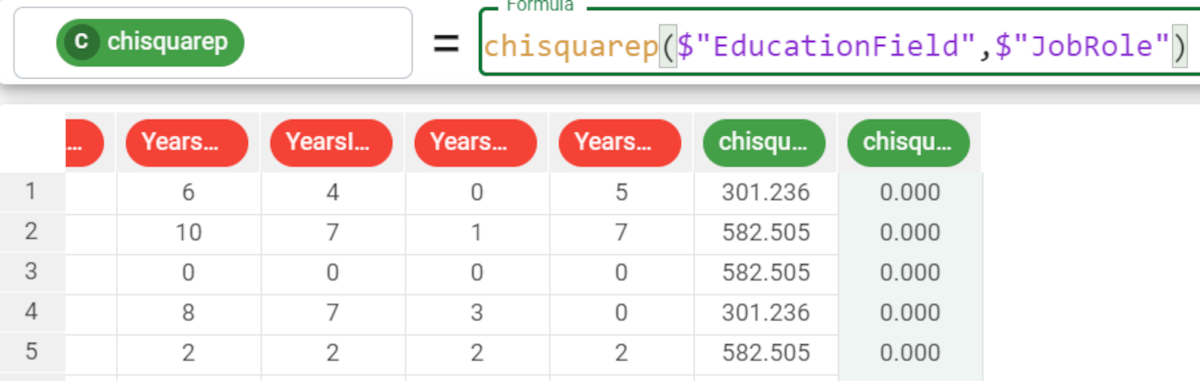 |
If we want our results to be grouped by another attribute, we simply add the attribute name to the formula. In this case, we also do not want to consider any missing values in the calculations, so we set the usemissing parameter to False. So our formula will be: | 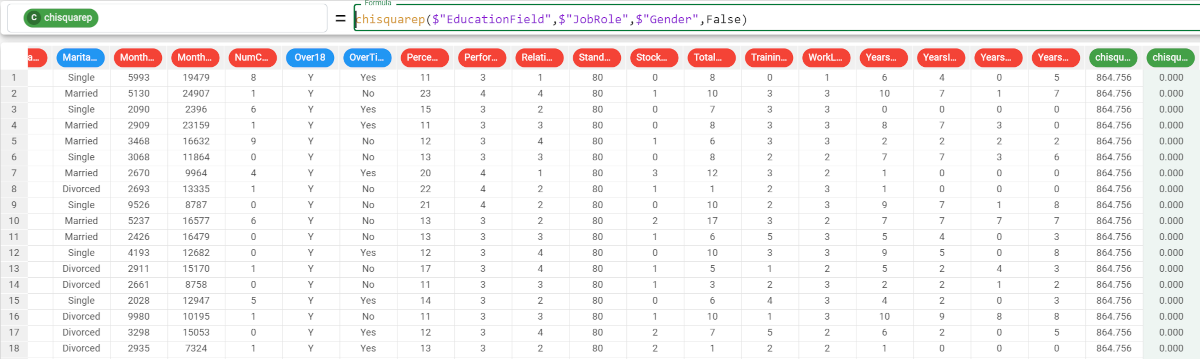 |