The Data Manager

The Data Manager is a central task: it allows you to perform several operations which involve, namely, data management. This task is located into the Visualization-Editing category.
With the Data Manager, we can:
understand whether all the data you require for your model is already included in your data tables, or whether you need to enrich the data tables with additional attributes created through formulas.
aggregate multiple rows to condense information into fewer more significant rows, for example by aggregating all the rows corresponding to a customer in a single row using the using the Group and Apply operations.
check if data are clear and coherent, for example by checking the attribute types are correctly defined. Note that an incorrect data type may have been incorrectly assigned automatically due to one or more values having been inserted with the incorrect format. If you try to change the data type to the correct type, Rulex will tell you which row contains the format error.
standardize the way missing values are expressed (for example, missing values can be represented with the letters "n/a", or a question mark).
explore data in the Sheets tab and Plot Manager, to check visibly if the data at hand are appropriate for solving your problem, and detecting and removing any abnormal data (i.e. outliers), which may alter the generated models. Outliers often contain valuable information about the process under investigation or the data gathering and recording process. Before considering the possible elimination of these points from the data, one should try to understand why they appeared and whether it is likely similar values will continue to appear. Of course, outliers are often bad data points.
It is divided in three main areas:
Main Data Pane
Manager Pane
Attributes Pane
We can then find two panels, located respectively at the top and at the bottom of the task window:
The Info panel, located at the bottom, where general information about the dataset and the selected attribute are displayed.
The Modeling Sets bar, located next to the Main Data Pane’s tabs: you can choose to display all the complete dataset, the training set, the test set or the validation set.
The Main Data Pane
In the main data pane you can visualize and perform various operations on data, like applying functions, creating plots or displaying statistics.
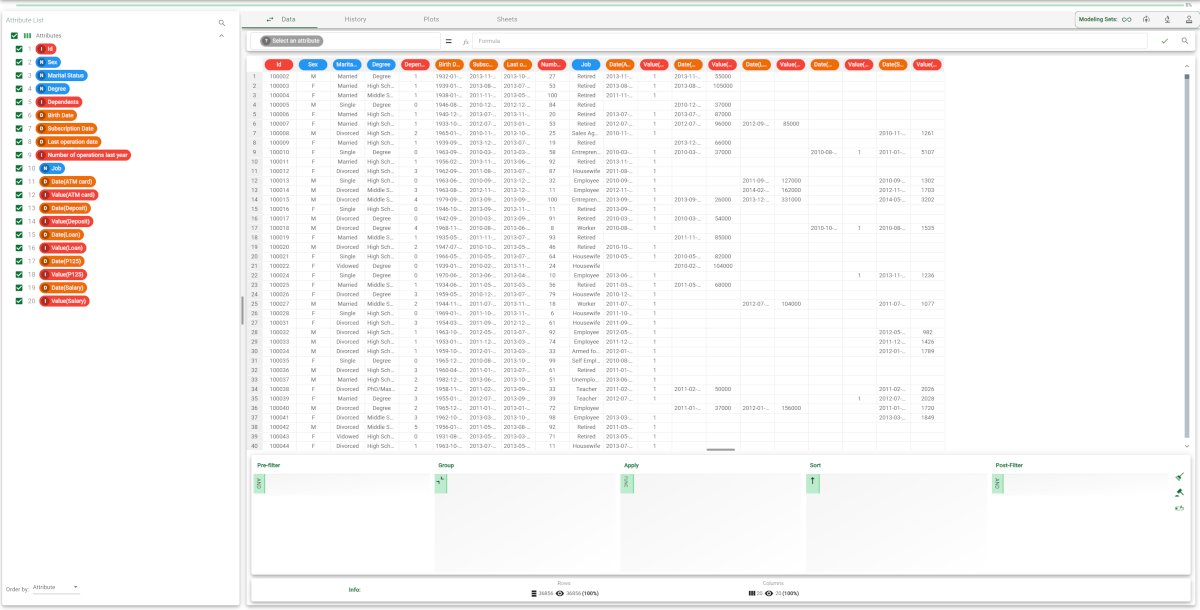
This pane contains the following tabs:
Tab name | Description | Relevant pages |
|---|---|---|
Data | Displays the data as a spreadsheet. | |
History | Displays all the operations performed during the current session, and allows you to move or delete some of these operations. | |
Plots | Displays the plots on data as defined in the Plot Manager. | |
Sheets | Displays the statistics on data as defined in the Sheets tab. |
The manager pane
You can find this pane in the following tabs:
Data
Statistics
Tab name | Description | Relevant pages |
|---|---|---|
Query Manager | Allows you to drag attributes in order to perform queries such as grouping, filtering and sorting data. | |
Statistic panel | Allows you to drag and drop attributes in order to calculate statistics. |
The attributes pane
The attributes pane displays a list of all the available attributes in the current dataset, and allows you to organize the attributes by changing their position, searching and sorting.
For a full list of all the operations that can be performed in this pane check the corresponding page: Managing Attributes in the Data Manager.