Performing Moving Windows Statistics in Data
Moving window statistics define temporal windows of data of a specific size and shape. The data within the specific window can be statistically summarized, using operations such as minimum / maximum values, standard/absolute deviation, mean, median and mode.
For each selected variable the rows of the resulting dataset will include, beside the present value, some of its past values and some of its future values (possibly resulting from aggregation), according to user selection. The suffixes -1, -2, etc. are added to the attribute name to denote past intervals, whereas the suffixes +1, +2, etc. are added for future values. Time relationships are established by looking at a specified temporal attribute or by using the row number (possibly in reverse order).
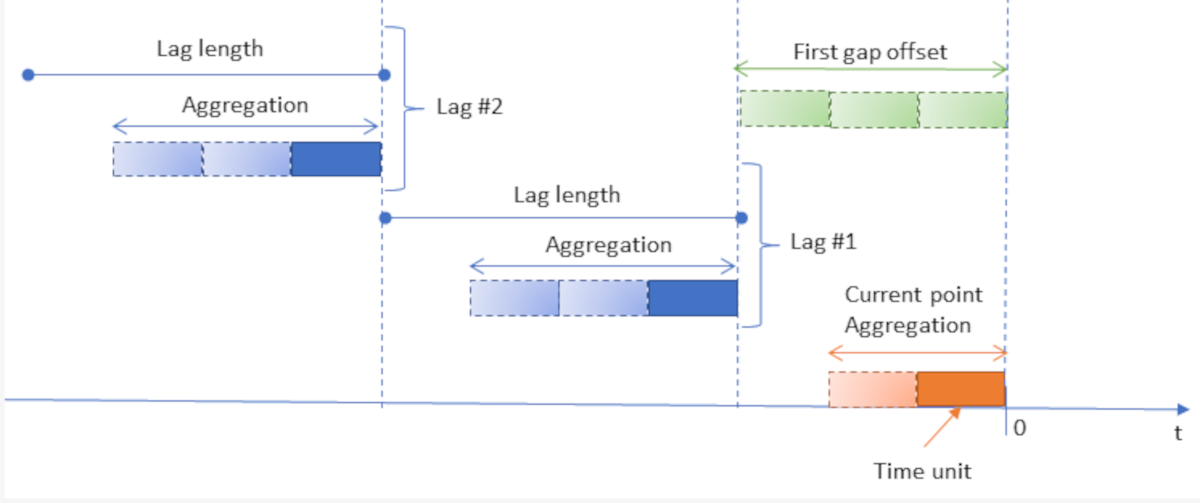
The graphic displayed in the Time Legend tab helps understand the temporal positioning of the various configurable options:
Prerequisites
you must have created a flow;
the required /wiki/spaces/RPDP/pages/2658467884into the flow.
Procedure
Drag the Moving Window task onto the stage and connect it to the task that contains the attributes you want to modify.
Double click the Moving Window task. On the left hand side of the pane there is a list of all the available attributes in the dataset, which can be ordered and searched as required.
Select the attributes that you want to keep in the dataset in the left hand list (tapnames); unselected tasks will be removed from the dataset after computation. Attributes can be checked/unchecked one by one or in groups by pressing the Ctrl or SHIFT key. Right-clicking this panel gives access to some additional options, such as checking/unchecking all attributes, inverting your selection, hiding ignored attributes, etc.
Configure the task options as described in the table below.
Save and compute the task.
Moving Windows Basic options | |
Name | Description |
|---|---|
Time attribute | Select a Time attribute from the drop-down list to specify the temporal attribute to be used to set the moving window. If not specified, row numbers will be used to establish the time relationship. |
Key attributes for multiple time series | Drag and drop the attributes that will control the moving window process from the attributes list on the left. A separate application of the task is performed for any group of different values assumed by the key attributes. |
Time unit | Specify the number of time units that determine a step back in the past or forward in the future (deltatime) and the unit of measure to be considered (timeunit). Possible values are second(s), minutes(s), hour(s), day(s), week(s), month(s), quarter(s), year(s). |
(Past samples) Number of lags | Specify the number of past intervals for each variable that will be added to the resulting dataset. |
(Past samples) Lag length | Specify the length of each past interval (expressed in time units). |
(Future samples) Number of lags | Specify the number of future intervals for each variable that will be added to the resulting dataset. Alternatively you can click the Copy past sample values button to use the same values specified for the past samples. |
(Future samples) Lag length | Specify the length of each future interval (expressed in time units). Alternatively you can click the Copy past sample values button to use the same values specified for the past samples. |
Remove incomplete starting values | Select if you don't want any initial rows containing missing data to be included in the resulting dataset. |
Fill missing values | Select if you want all the missing data in the resulting dataset to be filled with the nearest non-missing value in the right direction of time; in particular, past missing data are filled by checking subsequent values, whereas future data are filled by checking previous values. |
Moving Windows Advanced options | |
Type of aggregation for ordered attributes | Select which type of aggregation you want to use for ordered attributes from the drop-down list. Possible values are Minimum (1), Maximum (2), Sum (3), Mean (4), Median (5), Mode (6), Standard deviation (7) or Absolute deviation (8). |
Type of aggregation for nominal attributes | Select which type of aggregation you want to use for ordered attributes from the drop-down list. Possible values are Minimum (1) Maximum (2) or Mode (6). |
Use ratio values | If selected, past and future intervals will not be absolute, but will correspond to their ratios, according to the current value. |
Use trend values | If selected, past and future intervals will not be absolute, but will correspond to their differences, according to the current value. |
Reverse the direction of time | Select if you are using row numbers to establish the time relationship (as you have not specified a specific time attribute), and you want time to flow in the opposite direction with respect to row numbers. |
(Present samples) Number of time units for aggregation (current point) | Specify the number of time units you want to use to modify the current point. If you leave the value 1 no aggregation operations will be performed. |
(Past samples) First gap offset | Length of the gap between the current time period and the first period in the past (expressed in time units). |
(Past samples) Number of time units for aggregation | Specify the number of time units you want to use for past aggregation. If you leave the value 1 no aggregation operations will be performed; any values greater than 1 mean that a rolling mean (or a rolling mode in case of nominal variables) is performed for each past value to be added to the resulting dataset; the inserted integer value gives the number of past time periods to be considered for the rolling mean. If a Time attribute is defined, the distance is measured according to the specified time unit and the value provided for the Number of time units for aggregation, otherwise it is simply given by the number of rows. |
(Future samples) First gap offset | Length of the gap between the current time period and the first period in the future (expressed in time units). Alternatively you can click the Copy past sample values button to use the same values specified for the past samples. |
(Future samples) Number of time units for aggregation | Number of time units for future aggregation. If you leave the value 1 no aggregation operations will be performed, any values greater than 1 mean that a rolling mean (or a rolling mode in case of nominal variables) is performed for each future value to be added to the resulting dataset; the inserted integer value gives the number of future time periods to be considered for the rolling mean. Alternatively you can click the Copy past sample values button to use the same values specified for the past samples. If a Time attribute is defined, the distance is measured according to the specified time unit and the value provided for the Number of time units for aggregation, otherwise it is simply given by the number of rows. |
Example
The following example uses the Northwind dataset.
Description | Screenshot |
|---|---|
| 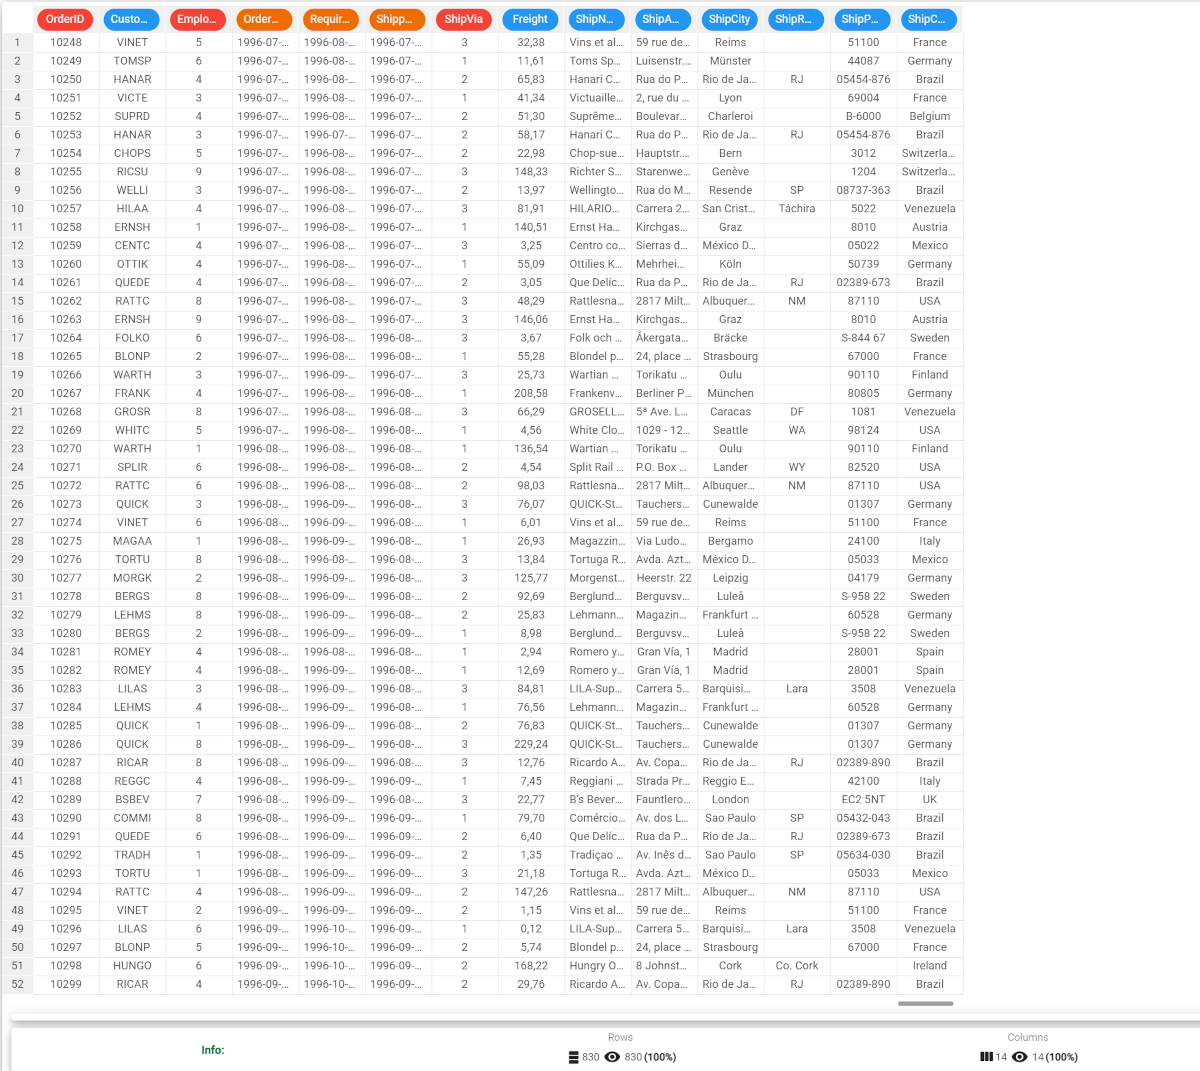 |
Save and compute the task. Only the Freight attribute is affected by the moving window process, with 2 past intervals and one future interval, by using the ShippedDate attribute to determine time periods (with a lag of one day). | 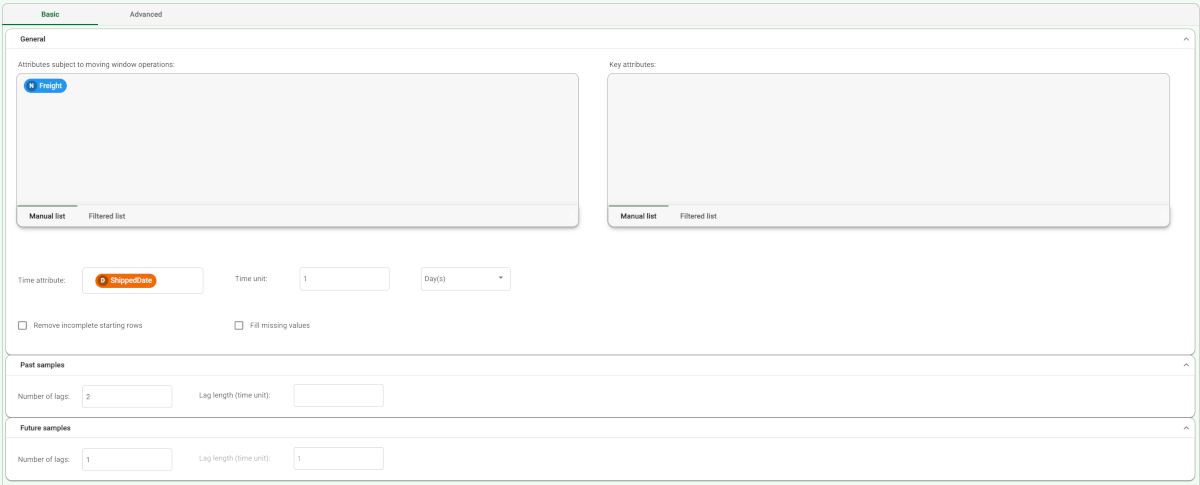 |
| 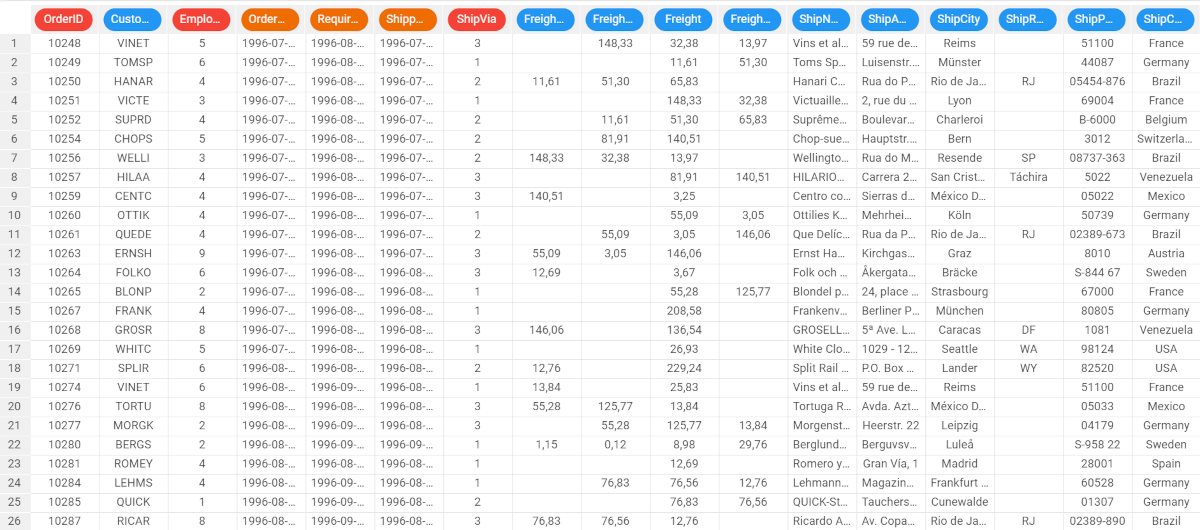 |
The resulting table is as displayed here: | 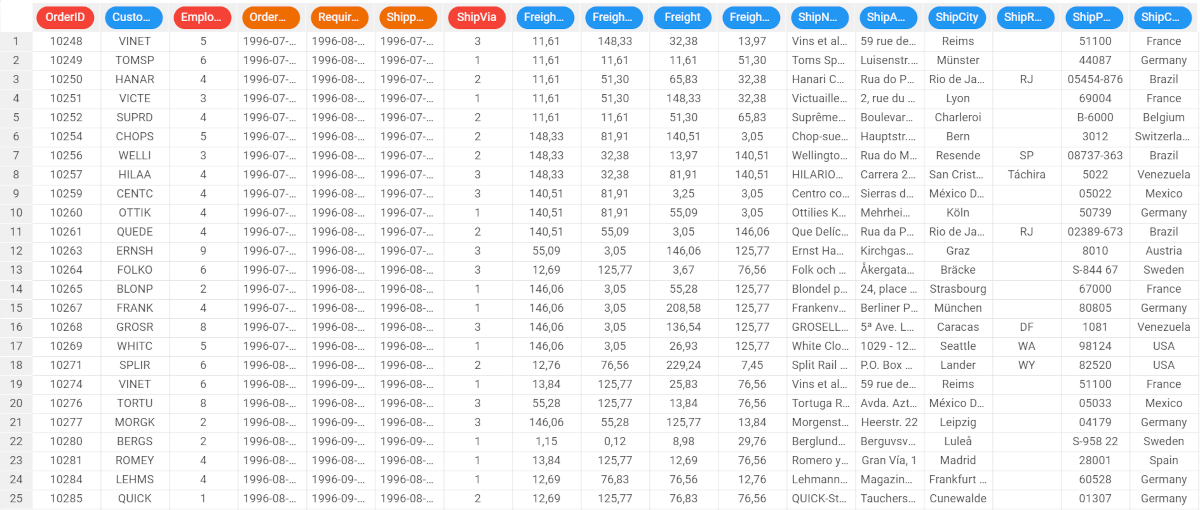 |